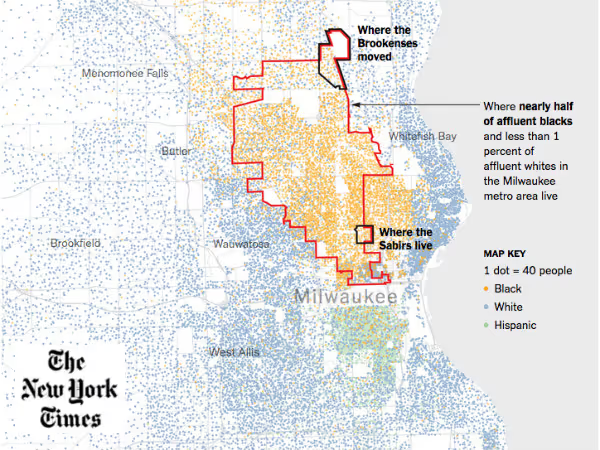
A new in-depth New York Times article on housing segregation in Wisconsin features charts and maps based on Social Explorer data. In "Affluent and Black, and Still Trapped by Segregation," reporters John Eligon and Robert Gebeloff explore why well-off black families end up living in poorer areas than white families with similar or even lower incomes.
It is a national phenomenon challenging the popular assumption that segregation is more about class than about race, that when black families earn more money, some ideal of post-racial integration will inevitably be reached. In fact, a New York Times analysis of 2014 census figures shows that income alone cannot explain, nor would it likely end, the segregation that has defined American cities and suburbs for generations.
The choices that black families make today are inevitably constrained by a legacy of racism that prevented their ancestors from buying quality housing and then passing down wealth that might have allowed today’s generation to move into more stable communities. And even when black households try to cross color boundaries, they are not always met with open arms: Studies have shown that white people prefer to live in communities where there are fewer black people, regardless of their income.
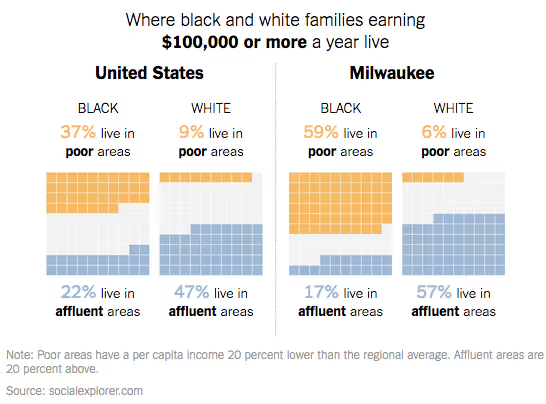
The result: Nationally, black and white families of similar incomes still live in separate worlds.
Focusing on Wisconsin, they examine demographic trends and the sociopolitical forces from the past and present. The following chart demonstrates the discrepancies between white and black families in terms of housing.
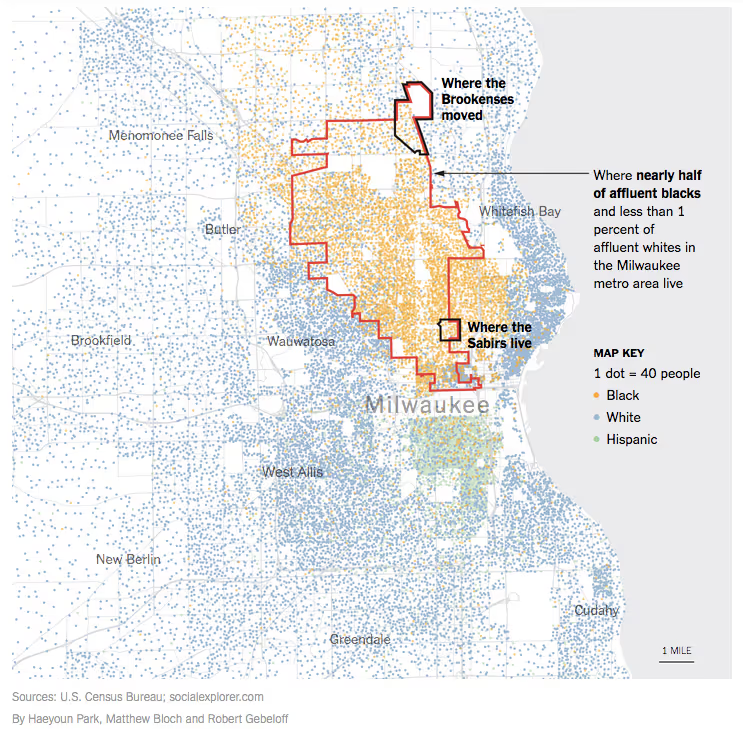
Maps illustrate the story of one of the families they follow in the story.
Read the full article here. And, if you'd like to do your own data-based reporting using demographic and economic data, try using Social Explorer, our award-winning demographic mapping software.