
Floods, storms, wildfires and other extreme weather events affect housing and communities around the nation. Rising homeowners insurance premiums due to natural disaster risk adds costs and instability to buying and maintaining a home. Social Explorer’s data library includes American Community Survey (ACS) estimates on homeowners insurance premiums, as well as several environmental datasets that enable researchers to identify and analyze the community-level impacts.
Tracking Homeowners Insurance Premiums:
In 2023, the Census Bureau’s American Community Survey (ACS) started tracking homeowners insurance data. The 2023 and 2024 data are available in the one-year and five-year estimates. The ACS counts owner-occupied housing units by their annual homeowners insurance cost, split by whether the home has a mortgage or not. The survey question captures annual homeowners insurance premiums paid (by detailed brackets from less than $100 to more than $4,000), which is increasingly relevant given rising insurance costs in high-risk areas.
The mortgage-status split is analytically useful: mortgaged homeowners are typically required by lenders to carry insurance, while owners without mortgages may have greater discretion over whether and how much coverage to maintain. Differences between these groups can therefore provide a starting point for examining insurance affordability and coverage patterns. However, mortgage status does not directly measure whether coverage is voluntary or adequate. Please also keep in mind that insurance regulations and availability may vary by state.
The five-year ACS estimates are available for mapping down to the county level, census tract, and block group. The following pair of maps shows a detailed view of homeowners with a mortgage paying premiums of $4,000 or more, and a map of median house values. Zoom in to see the patterns of premium prices and house values down to the tract and block group levels.
Focusing on the latest available data (2024 one-year estimates), a ranking of states by the share of premiums in the highest bracket shows notable differences by state and region.
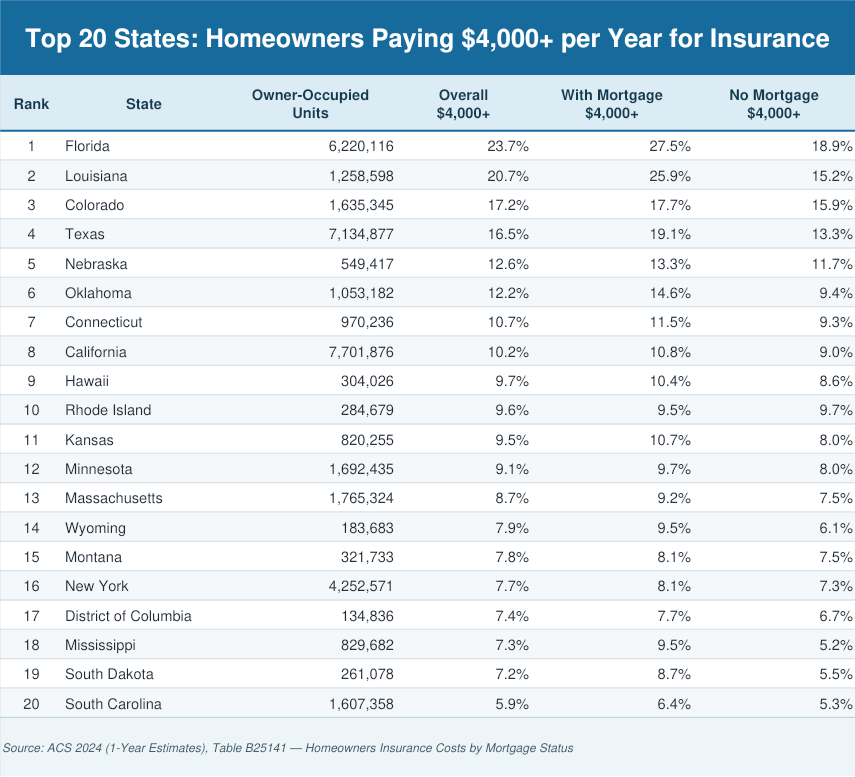
Florida leads the country in high insurance premiums at 23.7% overall — nearly one in four owner-occupied homes pays $4,000 or more annually. Among mortgaged owners, that jumps to 27.5%. Louisiana ranks number two at 20.7%, reflecting the state's well-documented insurance crisis driven by hurricane exposure and insurer exits. Colorado ranks third at 17.2%, and has a relatively small gap between homeowners with mortgages (17.7%) and those without mortgages (15.9%), indicating that high premiums extend across both groups.
The ACS does not provide a definitive count of uninsured homes, but it does count households reporting annual insurance costs below $100. This category offers researchers a starting point for investigating limited or absent coverage. It should not, however, be treated as a direct measure of uninsured homes.
In addition to leading the nation in high insurance premiums, Florida has a relatively large share in the under-$100 category (19.4%). This could suggest homeowners are choosing to drop coverage, insurance carrier options are volatile, or other local shifts are occurring, which analysts and planners could pursue further.
Louisiana shows a similar pattern with 21.2% of homeowners in the under-$100 category. The combination of high premiums and a large under-$100 share could signal affordability and coverage challenges in a climate-exposed insurance market.
Colorado’s under-$100 share is much lower, at 9.7%. These differences point to varying local conditions related to affordability, lender requirements, housing characteristics, and state insurance regulation. The three states also differ substantially in median home values and in the percentage of homes valued at $1 million or more—data that researchers could also examine in just a few clicks with Social Explorer.
While the insurance premium data is still relatively new in the ACS, changes from 2023 to 2024 can suggest directional trends. Colorado homeowners paying the highest premium threshold increased by 5.8 percentage points. Wildfire risk and insurer exits are likely contributors. The share of California homeowners paying $4,000 or more annually for insurance rose 2.9 percentage points during the same period when wildfires escalated in that state. Texas (increased 5.4 percentage points) and Nebraska (increased 5.1 percentage points) also experienced bigger jumps in high-premium payers, opening up new areas for further research.
Analyzing Environmental Risks:
Social Explorer offers a number of datasets related to climate, empowering users to investigate homeownership costs and environmental costs side-by-side. These resources include FEMA’s National Risk Index (NRI), the Census Bureau’s Community Resilience Estimates, Social Explorer’s update of the EPA’s EJSCREEN, and more.
For this analysis, we’ll use the 2021 NRI to help identify the risks and impacts of 18 different natural hazards including hurricanes, flooding, wildfires, tornadoes, earthquakes, and more. This dataset combines expected annual loss with social vulnerability and community resilience. The following map shows the NRI National Risk Score, focusing on areas with high insurance costs, such as Florida and Louisiana. Zoom in for more detail.
Additionally, researchers can parse individual hazards within the NRI data, such as coastal flooding or riverine flooding. The local numbers offer insight into possible relationships between environmental risks and home insurance costs. For example, high insurance cost brackets in coastal or riverine counties may signal elevated flood risk premiums baked into homeowners insurance policies. By contrast, areas with many uninsured or low-cost-insured homes in high flood-risk zones (from NRI data) could indicate financial vulnerability in the event of an environmental disaster. Combining NRI flood risk scores and home insurance data could help researchers identify where flood-exposed homeowners are underinsured relative to their risk, where state insurance resources could become overstretched, which communities need planning and construction initiative, and more.
Further Your Research with Social Explorer:
Social Explorer’s extensive data library and mapping tools help researchers identify and investigate risks, costs, and much more. Beyond the examples presented here, users could also examine additional facets including home values, the age of housing stock, and countless other socioeconomic factors. Let Social Explorer help you dig deeper, spot trends, anticipate planning and programming needs, support grant writing efforts, and gain more community intelligence.
New to Social Explorer? Sign up for a free Social Explorer account to try it out today.