
Like the Great Recession of 2007-09, the recovery from the COVID-19 pandemic has been a long, slow process, especially for businesses, according to a Social Explorer analysis of U.S. Census Bureau Business Formation Statistics. Available from 2006 to 2026, the dataset uses information from Employer Identification Number (EIN) applications filed with the IRS. The series tracks business formation applications at the national, regional, and state levels. It includes total applications, as well as those from corporations, businesses planning to pay wages, and "high-propensity" companies. In addition, Social Explorer provides year-over-year percentage changes for each application type.
In March 2020, when the World Health Organization declared the outbreak to be a global pandemic, the government recorded 335,800 new business formations. Of those, only 121,250 (about 36 percent) were considered “high propensity applications,” or corporations that were hiring employees and had a plan to pay them – in other words, businesses that were likely to succeed, at least in the short term.
The number climbed to 491,941 in March 2026, with 144,952 high-propensity applications, only about 29.5 percent of all applications. All told, the percentage of new business applications in March 2026 was 45 percent higher than in March 2020, and the percentage of high-propensity business applications was 23 percent greater.
The figures are somewhat encouraging when compared to the 2020 numbers, when new business formations plunged 25.4 percent from March 2019 and high-propensity applications dropped 22.5 percent. In March 2026, total business applications had increased by a median of 7.8 percent from March 2025; high-propensity business formations grew by 5.3 percent.
The Social Explorer analysis found that the gains were uneven, with some states reporting much greater success in attracting new businesses than others. Predictably, California, Florida, and Texas posted the greatest increase in new business applications when comparing March 2020 with March 2026. Florida led the way, with an increase of 19,114 new business applications, 1,969 of which were likely to succeed when comparing March 2026 and March 2020.
Texas was No. 2 with 17,261 total applications, but boasted 3,289 high-propensity applications, the most in the nation. California, which would have the world’s fourth- or fifth-biggest economy if it were a separate country, posted 9,384 new business applications but had 356 fewer high-propensity applications in 2026 than in 2020.
Florida had the second-highest number of high-propensity applications, and Wyoming was a surprising third with 1,969 more high-propensity applications in March 2026 than in March 2020.
Raw numbers, however, seldom tell the entire story since they’re generally – with a few exceptions – weighted towards states with larger populations. An analysis of Census Bureau statistics finds that states in the western U.S. have added a higher percentage of new businesses than states in other regions. Wyoming, for example, increased its total applications in March 2026 by 277 percent over March 2020, and high-propensity businesses by 209.8 percent, far outpacing the rest of the nation.
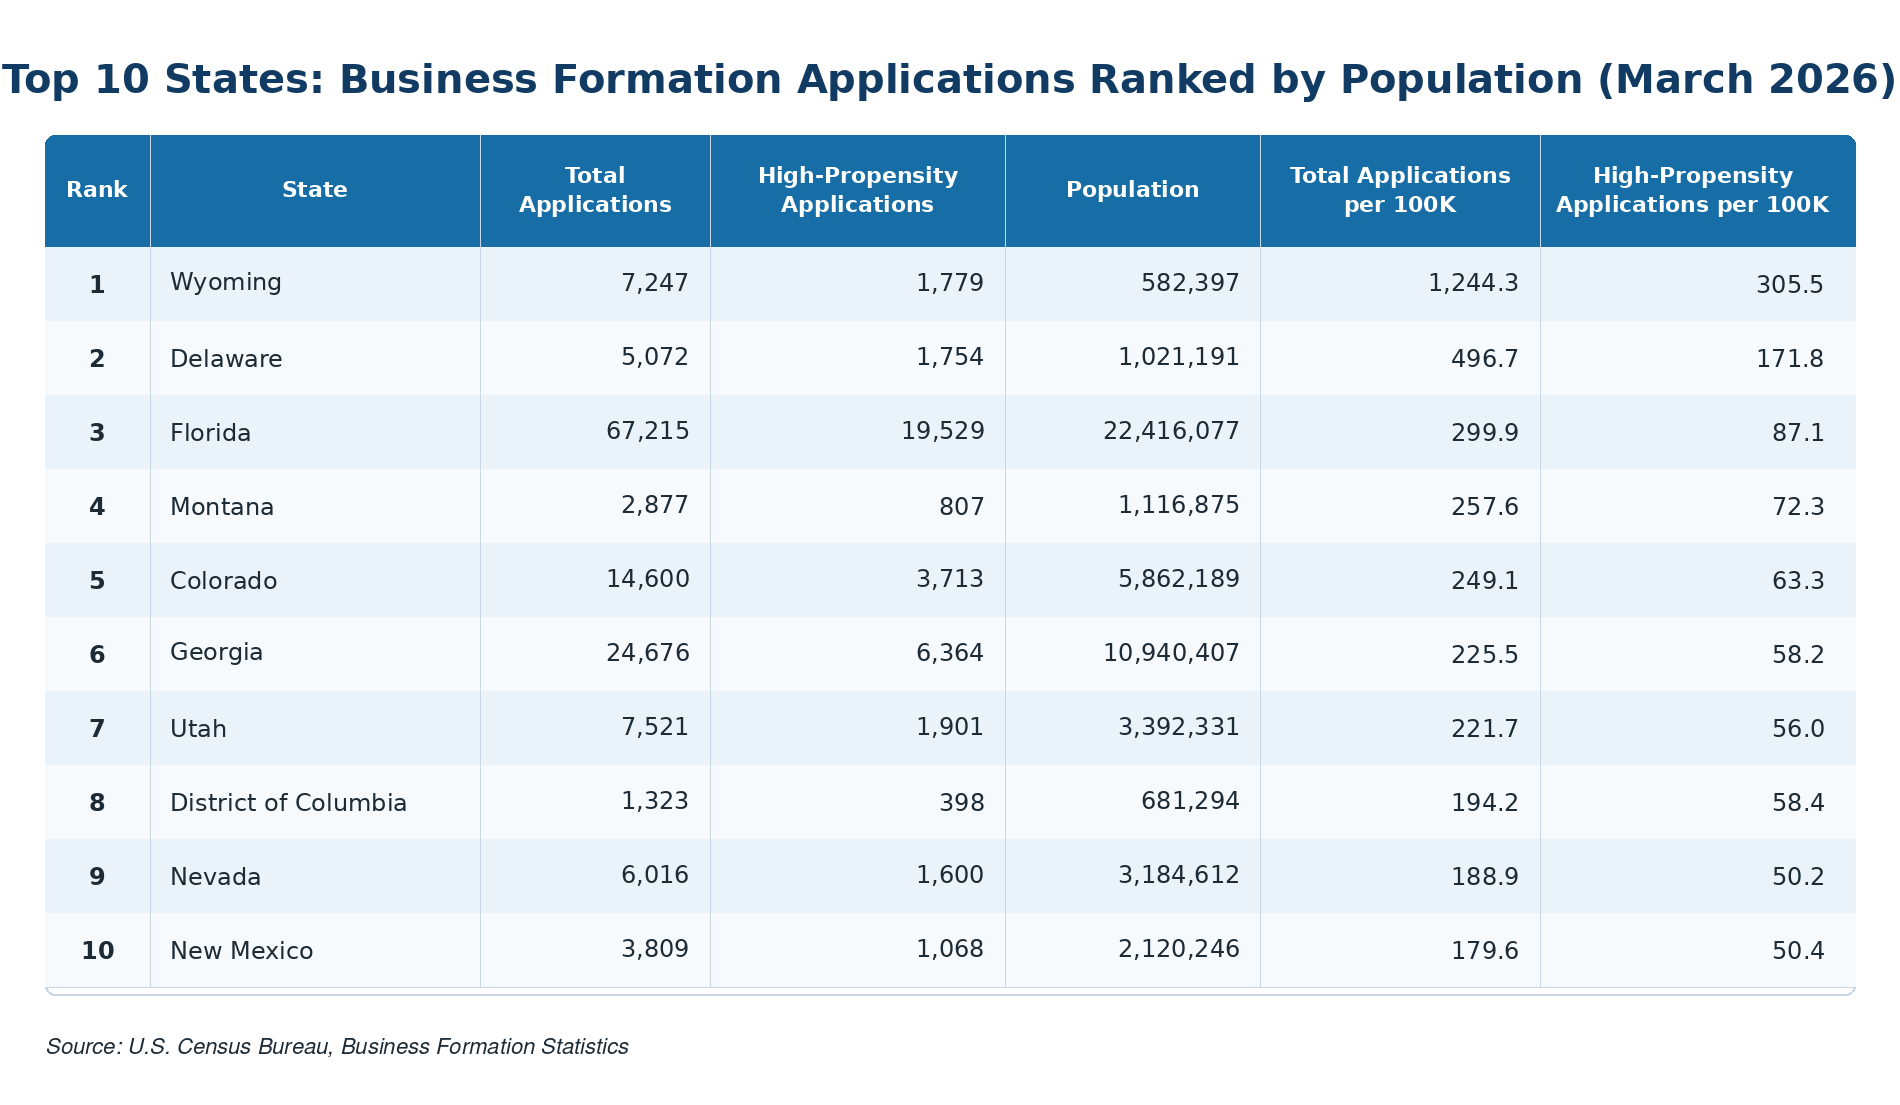
New Mexico saw its business applications rise by 130.5 percent, while high-propensity filings shot up by 92.1 percent. Montana was No. 3, with overall business applications increasing 106.4 percent between March 2020 and March 2026; the percentage of businesses likely to succeed rose 104.5 percent.
Smaller states, especially those with aging populations, haven’t fared as well. Alaska, one of the most sparsely populated states in the country, was the only place to do worse in March 2026 than in March 2020. Its troubled economy posted 19 fewer business applications in March 2026 than in March 2020, and the number of high-propensity applications fell by 23. It was the only state to have both fewer businesses and high-propensity business applications when comparing the two months.
The District of Columbia also fared relatively poorly. It had only 56 more total applications in March 2026 than in March 2020, and 44 more applications from businesses that were considered likely to succeed. North Dakota, which had 188 more business applications in March 2026 than in March 2020, also had a low count of likely successful businesses, adding only 31 applications.
To be sure, much has changed between March 2020 and March 2026, beyond the pandemic, and the ground has shifted since then. The U.S. started a war with Iran on Feb. 28, 2026; its effects continue to manifest as higher, more volatile prices for energy and food, both of which can affect decisions to start new businesses. Meanwhile, much of the country's economic growth has been spurred by corporate investment in technology rather than traditional consumer-driven spending. And the Federal Reserve Board, which has an outsize influence on business formation by setting interest rates, has not taken any action since March, leaving potential business creators wondering about the future.
But for the most part, business formation numbers in March 2026 indicate some improvement from the depths of the COVID-19 pandemic in March, when the economy teetered on the edge of breaking down. In March 2020, the Dow Jones Industrial Average lost 20 percent of its value, the Federal Reserve slashed interest rates to zero, and consumer spending fell a record 7.5 percent.
So, in other words, this improvement from March 2020 represents an extraordinarily low bar that the March 2026 figures have cleared, but not by as much as one might have hoped or expected.
Analyze More Economic and Business Data with Social Explorer:
Further examination of the types of businesses, their locations, local laws, and more could add even more context. For example, Wyoming, home to a business formation boom, has no personal or corporate state income tax, and has enacted other business-friendly policies making it more attractive.
Discover more of Social Explorer’s economic and business research resources in our data library. Our collection includes more data than ever, plus more demographic, socioeconomic, transportation, urban planning, and other resources. Available economic and business datasets include:
Building Permits (Census Bureau)
County Business Patterns (Census Bureau)
Quarterly Workforce Indicators (Census Bureau)
Unemployment Statistics (Bureau of Labor)
Regional Price Parities (Bureau of Economic Analysis)
New to Social Explorer? Sign up for a free Social Explorer account to try it out today.