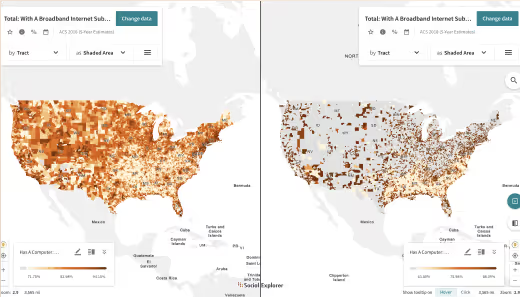
Brown v. Board of Education, the 1954 Supreme Court decision that enabled segregated schools, may have put an end to physical “separate but equal” but it didn’t address the possibility of a virtual “separate but equal.” As online classrooms replace physical learning for millions of American schoolchildren during a global pandemic, a Social Explorer analysis of 2014-18 American Community Survey data finds the percentage of Black households with no internet is almost twice that of white households.
Almost 25 percent of Black households lack a broadband internet connection; only 13.4 percent of white, non-Hispanic households don’t have high-speed internet access. Slightly more than 20 percent of Hispanic households lack access to broadband. Asian households, meanwhile, are the most well-connected in the nation, with only 7.5 percent not having broadband.
Among white, non-Hispanic households, the District of Columbia (96.4 percent) has the highest rate of broadband connection. For Black households, it’s Hawaii, where 94.3 percent of the state’s 23,194 have fast internet speeds. For Asian households, it’s Virginia (95.6 percent), and for Hispanic households, New Hampshire tops the list with 89.4 percent broadband penetration.
Use Social Explorer’s award-winning demographic mapping software to see broadband penetration by race in your state, and to explore any other question you have with the rest of its data library.