
Social Explorer created the AI Exposure Index (AIEI) to help users analyze the potential impact of artificial intelligence on workers and their communities. This custom index illustrates how exposure to AI varies across different occupations, employment centers and neighborhoods in today’s rapidly changing labor market.
The methodology behind Social Explorer’s index builds on a 2025 paper by Kiran Tomlinson and colleagues at Microsoft Research. Their study, Working with AI: Measuring the Applicability of Generative AI to Occupations, analyzed over 200,000 real-world interactions with a generative AI system and mapped them to occupational tasks using the Bureau of Labor Statistics’ Standard Occupational Classification (SOC) system. The analysis produced an AI applicability score for each occupational group, indicating how relevant AI is to their job functions.
This index offers two perspectives on AI exposure: where people work and where they live. These options allow users to examine AI’s potential impact on employment hubs as well as on residential communities. As the examples in this analysis will show, the two sometimes differ, particularly in areas with a lot of commuting.
How the Workplace-Based AI Exposure Index Works:
The workplace-based AI Exposure Index (AIEI) measures how a community’s workforce could be affected by generative AI, based on the local EASI employment-by-place-of-work data and American Community Survey (ACS) occupation data. The Social Explorer dataset offers a rank of AI exposure, a percentile to compare to all other areas, and a normalized index score. We will use the index for mapping and comparisons. It produces a composite index score centered on 100. Higher values indicate a workforce more exposed to AI use and automation, and scores above 100 indicate above-average exposure relative to the national distribution.
Communities with higher AIEI scores have greater concentrations of information-based and cognitive occupations in which generative AI is more readily applicable. Occupational categories like "Computer and Mathematical," "Sales and Related," and "Office and Administrative Support" have among the highest levels of exposure. High AI exposure does not necessarily mean that workers are being replaced. Rather, it indicates that the local workforce is concentrated in occupations whose tasks are particularly applicable to generative AI.
Communities with a lower AIEI score typically have more employment in manual, physical, or in-person service occupations. These include categories such as “Healthcare Support," "Farming, Fishing, and Forestry," and "Construction and Extraction."
The following map shows the workplace-based AI Exposure Index for commuting zones across the country. Commuting zones define local labor markets based on commuting patterns rather than political boundaries. They cross county lines and include both urban and rural areas.
The workplace index provides insight into AI exposure across local economies, employment centers, and business districts. The dataset supports analysis at geographic levels including nation, state, city, county, census tract, block group, and commuting zone. Please note that workplace-based results can get noisy in very small geographic areas with only a small number of jobs or employers, so the measure is more useful for analyzing larger geographies or known employment centers.
An analysis of counties with at least 100,000 employed workers shows the employment centers with the highest and lowest AI exposure.
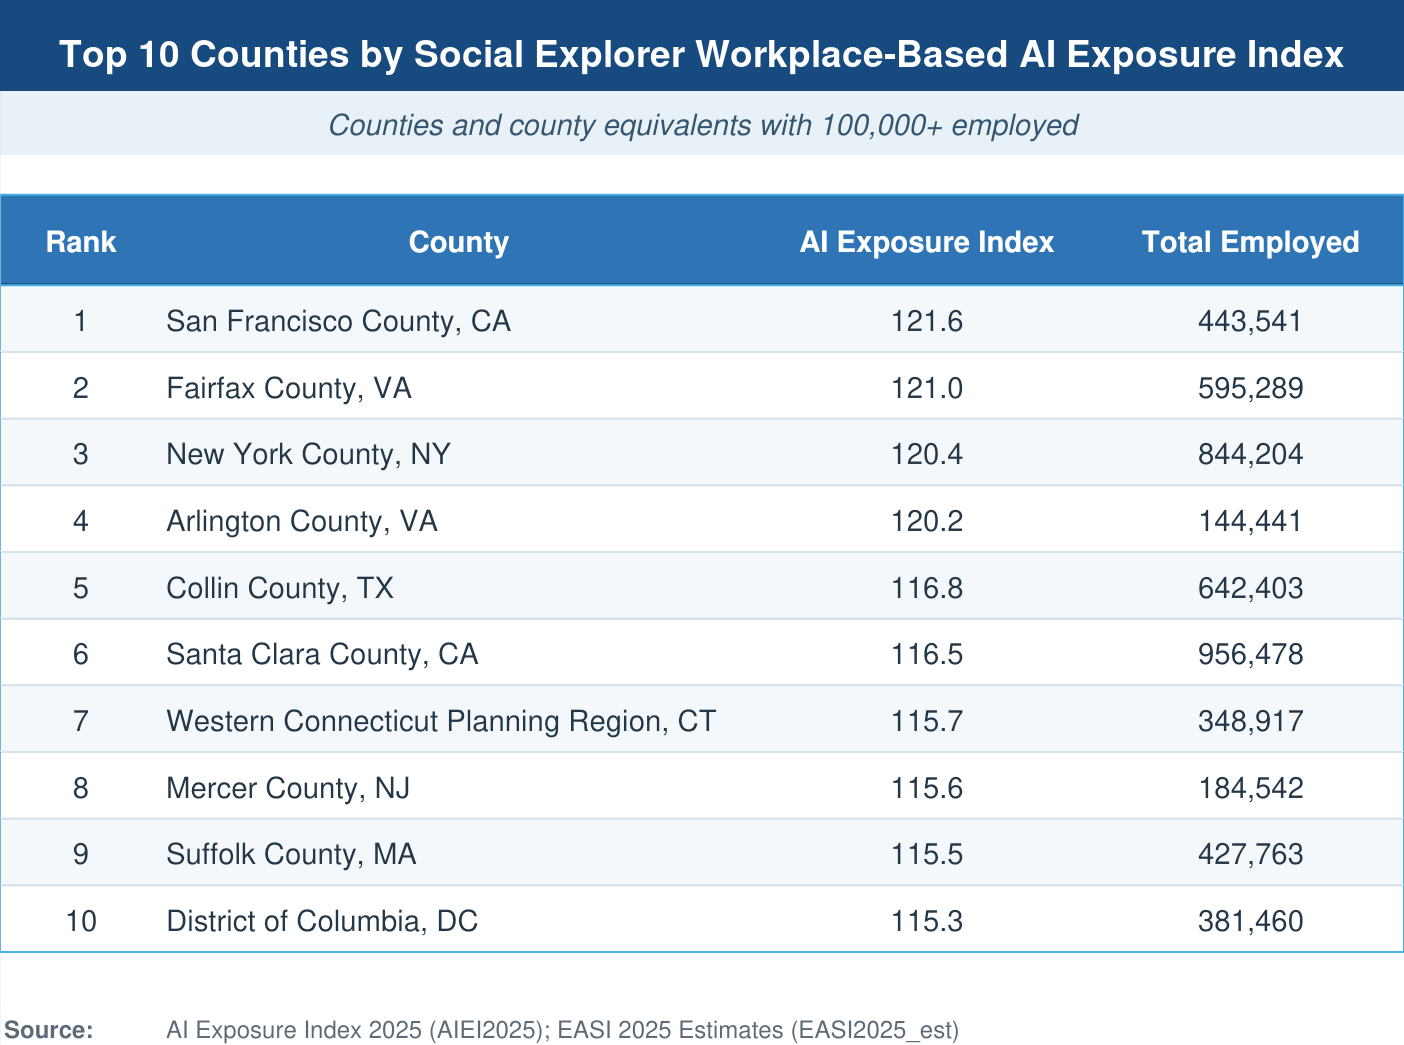
The most exposed counties--San Francisco County, CA (121.6), Fairfax County, VA (121.0), and New York County, NY (120.4)--are knowledge-economy hubs with high concentrations of tech, finance, and professional services workers.
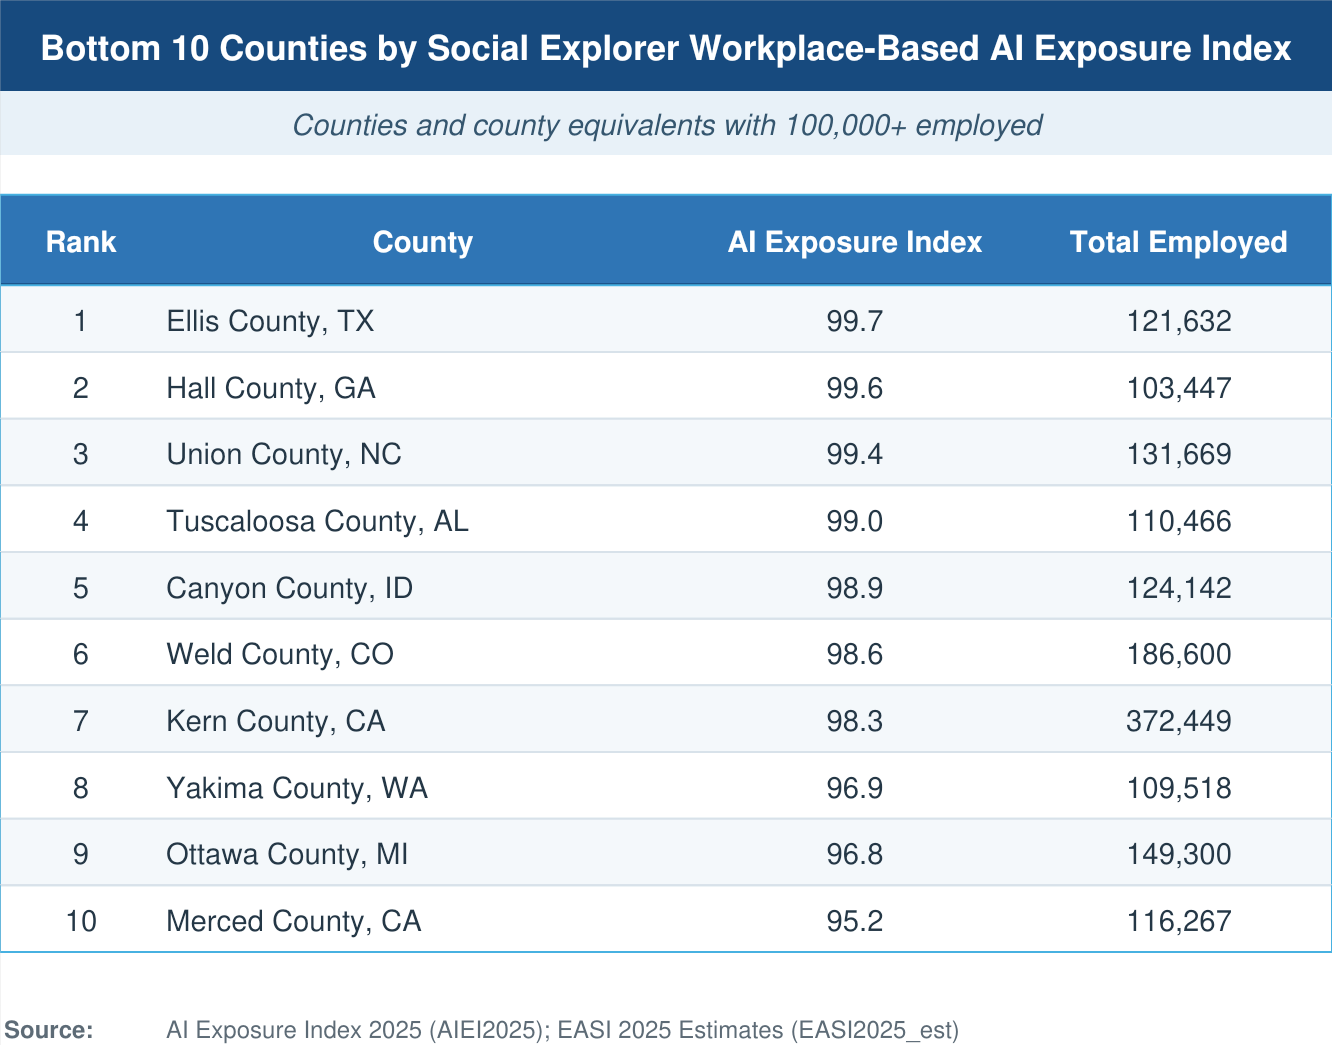
By contrast, the least exposed counties are Merced County, CA (95.2), Ottawa County, MI (96.8) and Yakima County, WA (96.9). These agricultural and manufacturing-oriented labor markets have occupational mixes with lower generative AI applicability.
A Residence-Based Analysis of AI Exposure:
In addition to the workplace AI Exposure Index, Social Explorer also provides a residence-based AIEI index that focuses on people and communities. The index can help researchers examine AI exposure of local residents, identify where retraining or workforce development programs may be needed, and more. An analysis of counties with at least 100,000 employed residents shows the communities with highest and least exposure.
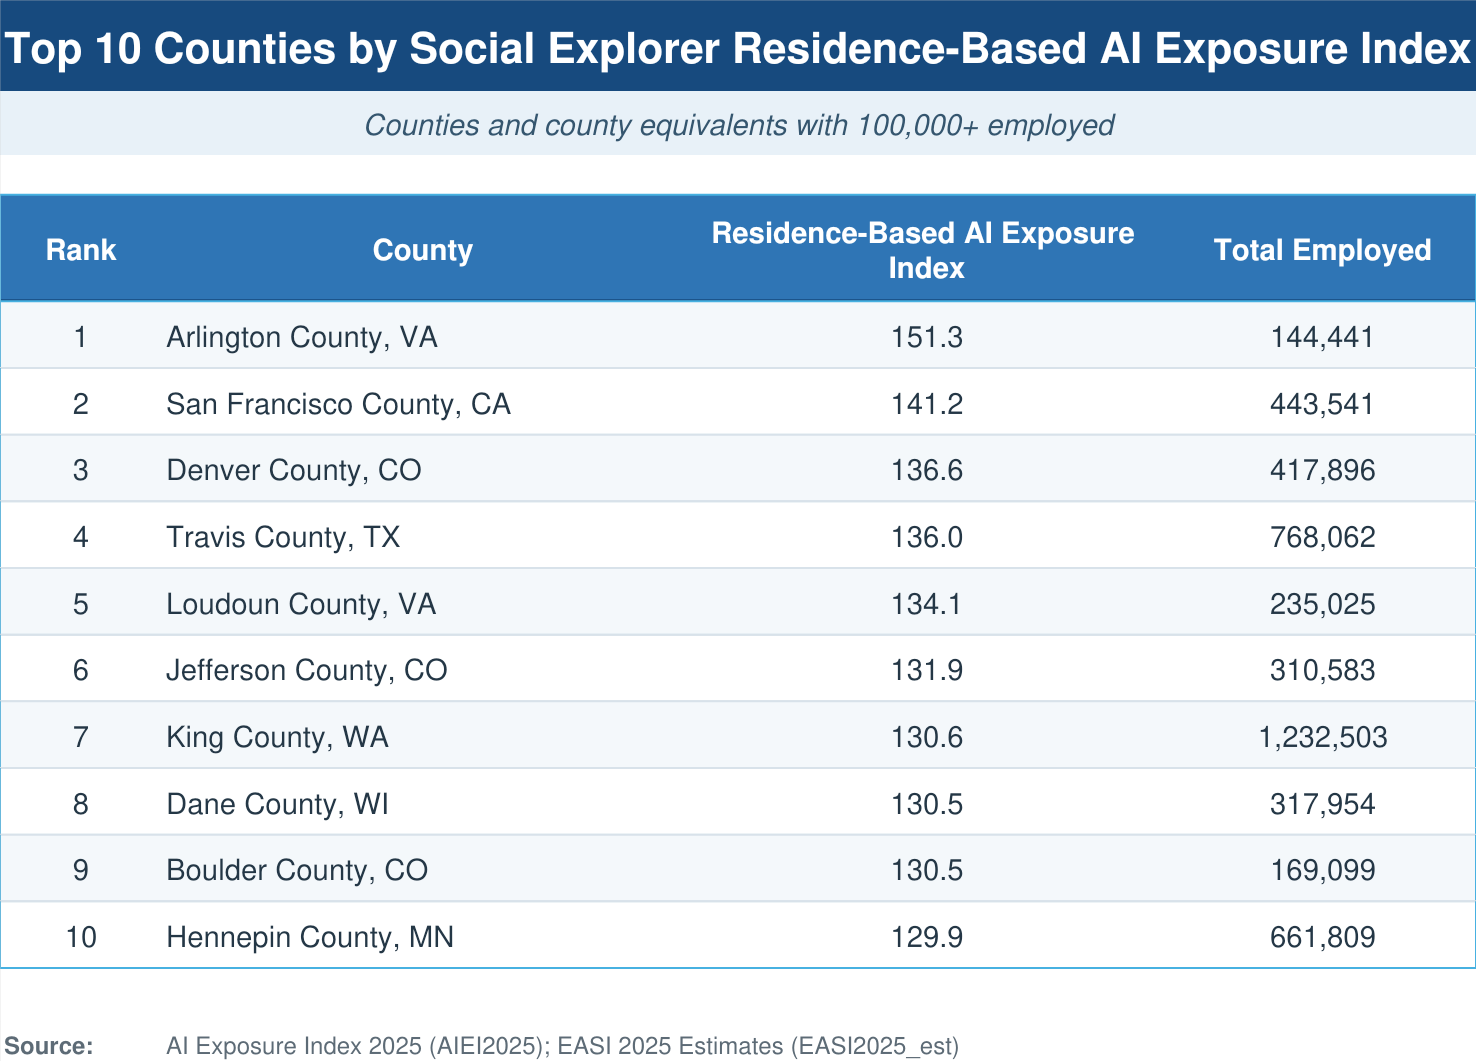
Arlington County, VA, ranks first with a score of 151.3. It is home to many highly educated professionals who commute into Washington, D.C.'s high-AI-exposure job market. Elsewhere in Virginia, Loudoun County ranks fifth with a score of 134.1 and Fairfax County ranks 13th with a score of 129.6. These results reflect Northern Virginia’s concentration of residents working in technology and other knowledge-based industries. San Francisco, CA, ranks second at 141.2, and Travis County, TX, ranks fourth at 136.0. Both are also home to large tech workforces.
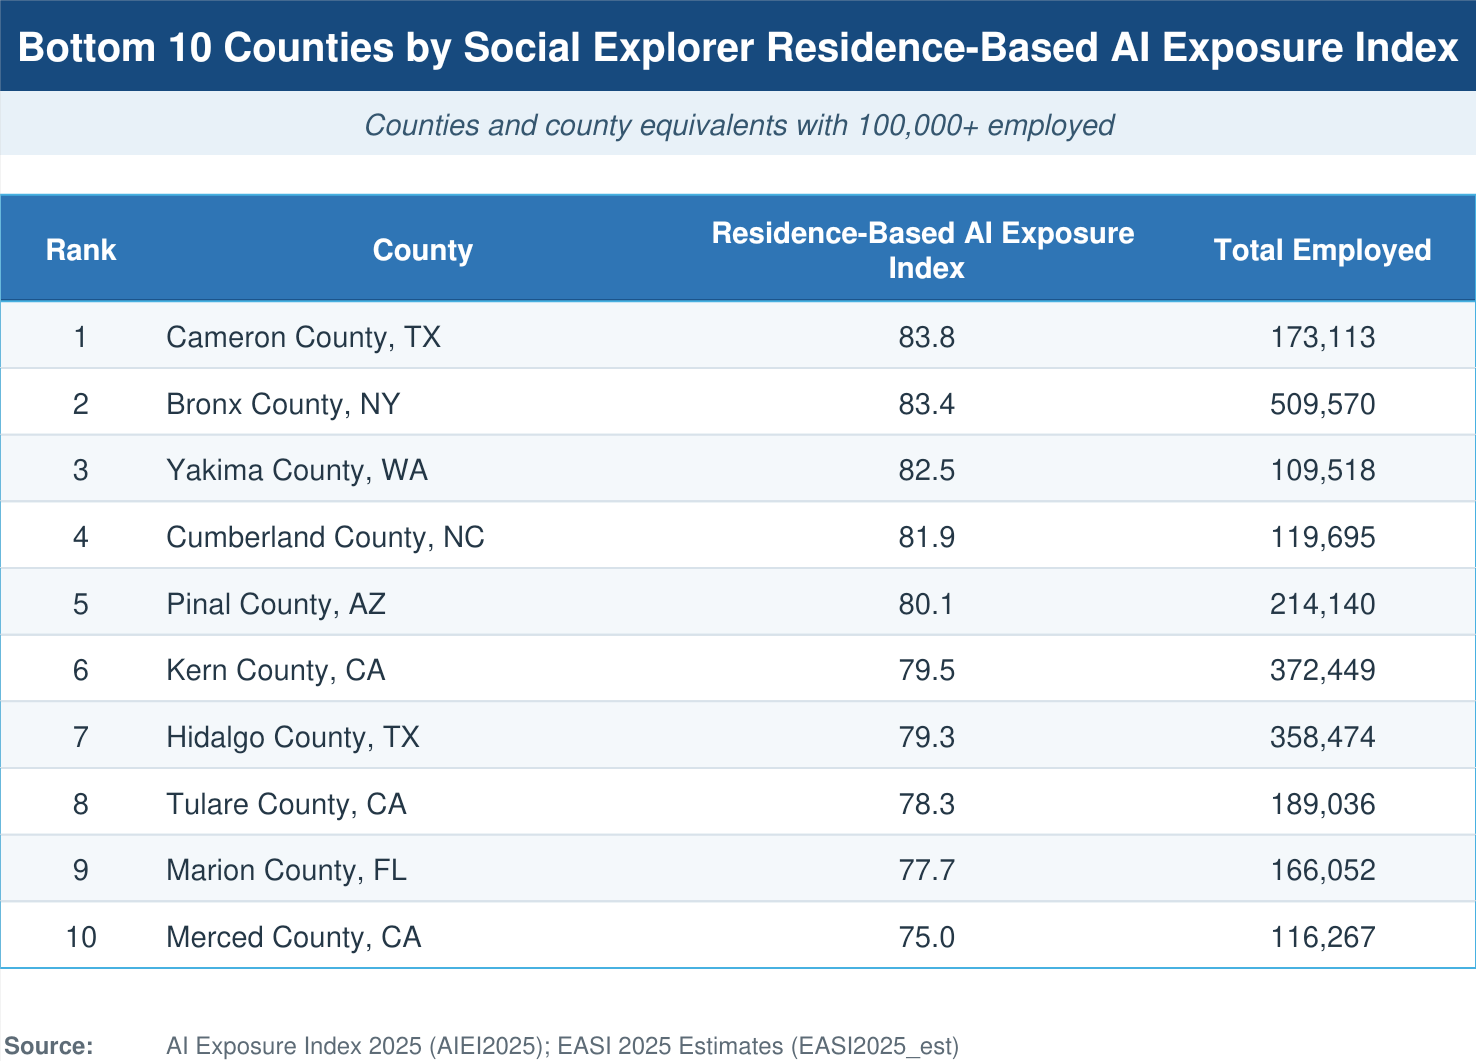
At the bottom of the list, agricultural counties like Merced, CA (75.0), Tulare, CA (78.3), and Hidalgo, TX (79.3) remain among the least AI-exposed, whether measured by workplace or residence.
Comparing the workplace- and residence-based rankings also highlights the connections between where people work and where people live, such as those commuting to Washington, DC. Additionally, while New York County (Manhattan) appeared high on the workplace-based AIEI list, Bronx County appears low on the residence-based AIEI list, showing the very different dynamics going on within New York City.
Relating AI Exposure to Other Socioeconomic Factors:
In addition to the exposure measures, Social Explorer’s AIEI dataset includes 16 socioeconomic indicators describing the broader economic profile of each area. Drawn from the economic-resilience literature, these indicators provide context for interpreting AI exposure. They include median income, labor-force participation, educational attainment, and the Herfindahl-Hirschman Index (HHI). HHI measures how concentrated local employment is across industries. A lower HHI indicates a more diversified and generally more resilient local economy. These socioeconomic indicators helped form the indices.
Social Explorer gives users access to a diverse set of data resources to conduct deeper socioeconomic analysis. As AI’s role in the workplace continues to evolve, researchers can examine possible relationships among AI exposure and other community characteristics, such as income, education, labor force participation, industry composition and more. ACS five-year estimates and other datasets available in Social Explorer’s library add detail on these topics and more.
Analyze the Future of Work and More with Social Explorer:
Social Explorer’s AI Exposure Index and related datasets provide new insight into the future of work and workforce trends. Whether focusing on employment hubs or residential communities, Social Explorer offers a distinctive dataset plus a suite of resources and tools perfect for researchers, planners, journalists, grant writers, policymakers, and more. Subscribers can visit our data library and mapping tools to get started.
New to Social Explorer? Sign up for a free Social Explorer account to try it out today.