Switch or compare years in New Reports
The change over time feature in our new reporting tool allows you to view data of interest for multiple years. You can switch between the years available for your selected table or compare up to three years in one report. This allows you to change years while keeping preselected geographies and tables.
You can also download the same report for different years in just a few simple clicks rather than recreating a report manually for each individual year.
Switch or compare years
To first create a data report using our new Reports tool, follow the steps outlined in this guide. Once you’ve created your report, follow these steps:
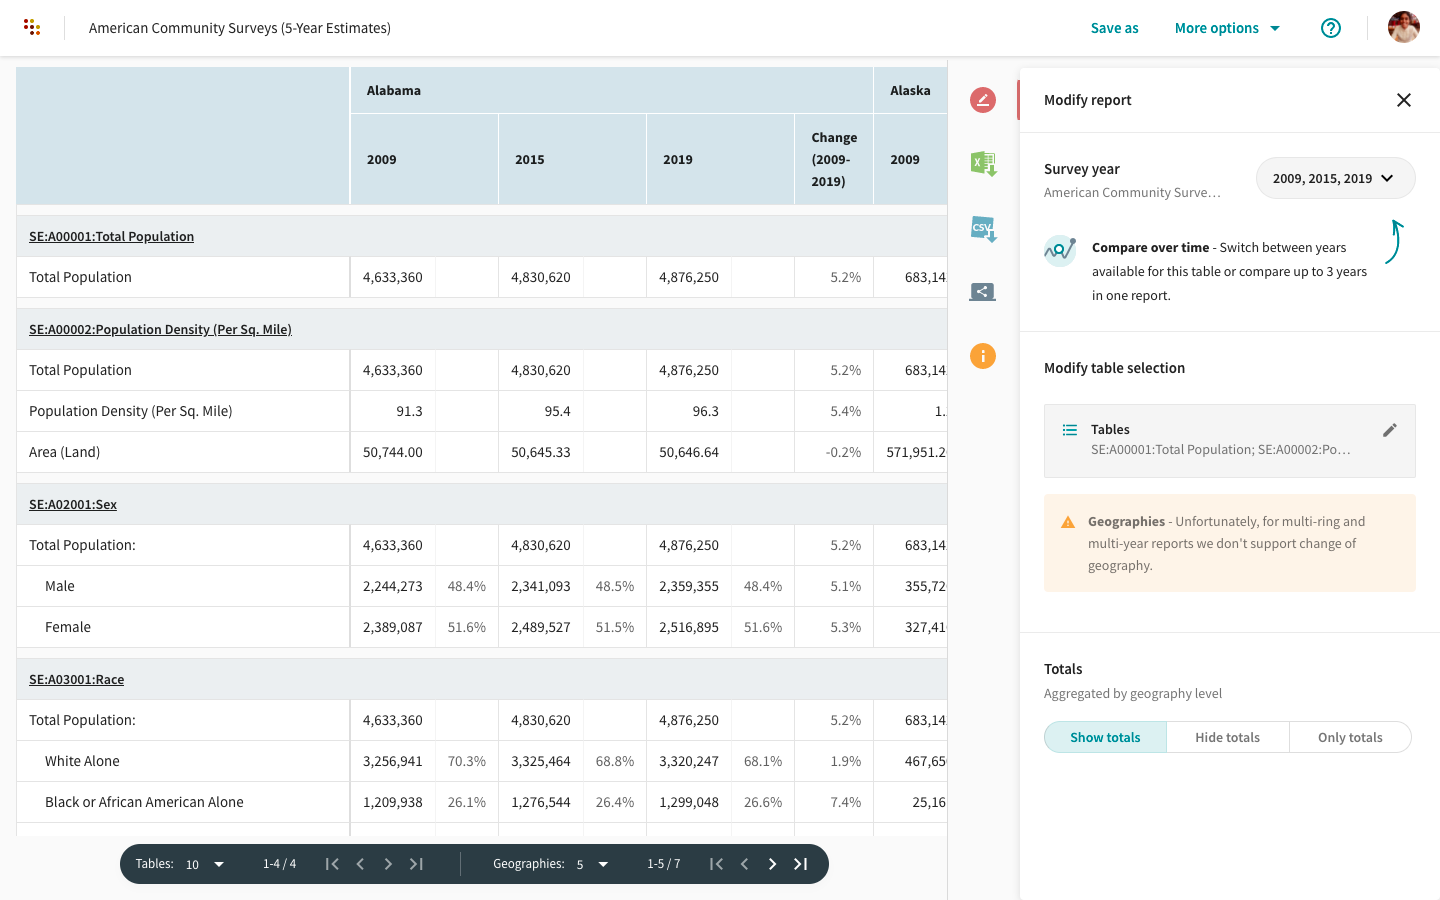
- Click on the
icon to modify your report.

- Click on the Survey year dropdown to switch the year or choose the years you wish to compare. You can select up to three.
- Click Apply.
- A new screen will appear showing you the percentage of geographies and tables that match your selected years. Click Confirm to continue.


Our change over time and switching between years functionalities are only available across comparable surveys and geographies. If the geographies or tables do not match, you’ll be unable to proceed with this step and will only be presented with the option to Cancel.
Your report will now display data for your selected year/s.
It is possible that some geographies and tables may be missing for certain years. These will appear blank on your newly created report.
We’ve disabled these functionalities for certain datasets. For instance, we have not enabled change over time for decennial census data because the data is not completely normalized. In that case, you’ll notice the ![]() icon next to the survey name in your created report to indicate this.
icon next to the survey name in your created report to indicate this.
To learn how to download your reports, follow this guide.