Introduction to New Reports
With our updated, multifunctional, and easy-to-use Reports tool, creating reports has never been simpler. First, you’ll be able to choose all of the parameters for your report. Next, you’ll be able to modify, download, and share your newly created report while in a table view.
We’ve also added a range of functionalities: changing survey years while keeping your preselected geographies and tables, exploring change over time data, and a new citation tool.
Create a Report
To create a data report using our new Reports tool, follow these steps:
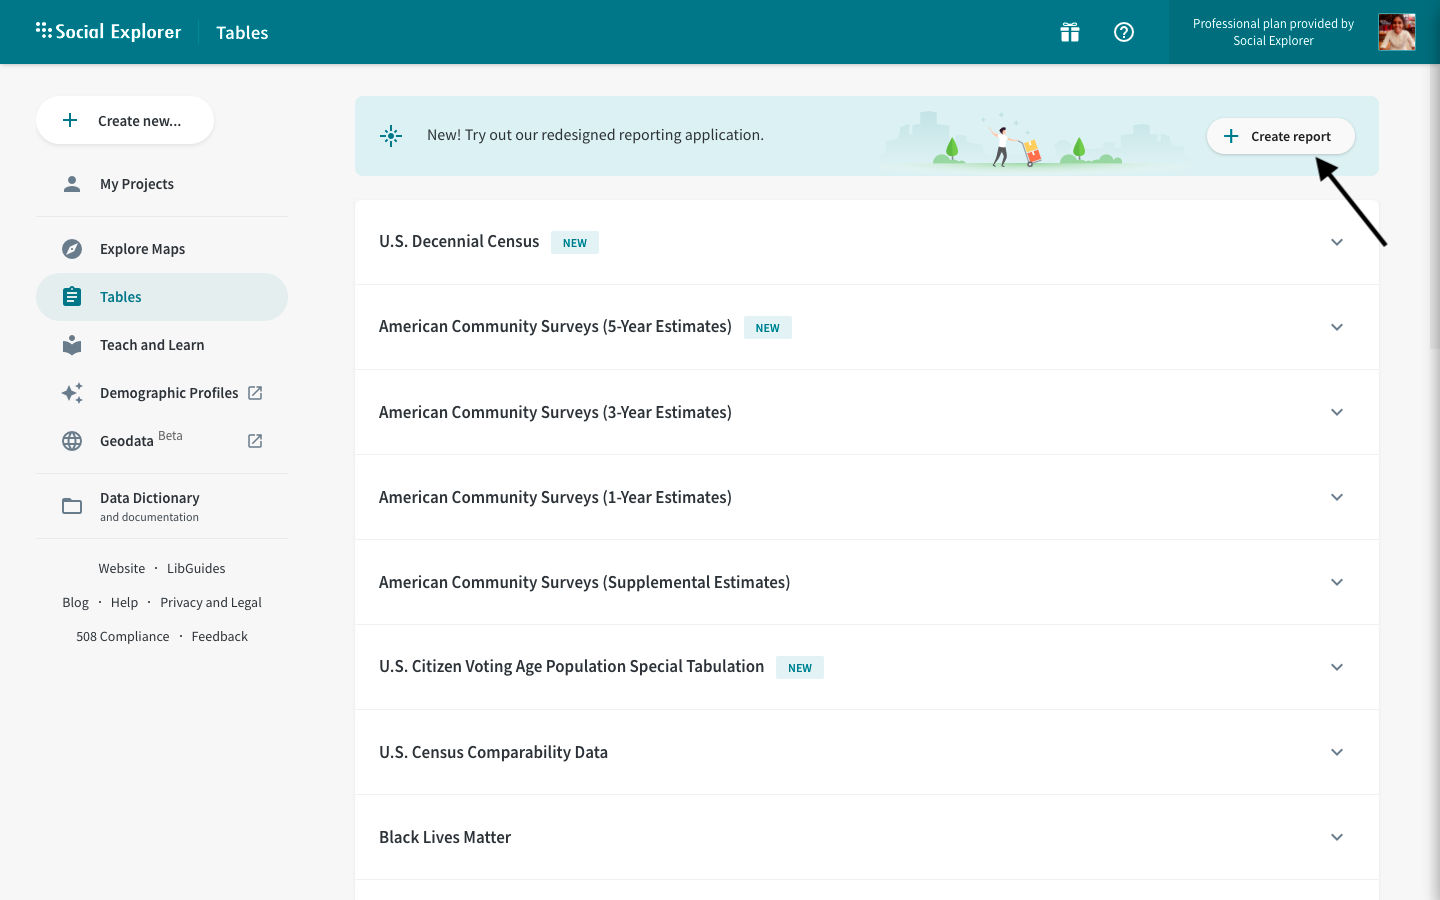
- Navigate to the Tables page on your Social Explorer dashboard and click Create report.

- On the Create report page, choose the survey or year you’re interested in. We've also added a search bar to help you find the survey you need easily.
- From the Select geographies dropdown, click on +Add geographies by type or use the search bar to select the geographies for your report.
- Once you’ve selected your geographies, click Add.
Adding geographies through FIPS codes has also been upgraded for a seamless experience. To add geographies by FIPS codes, select geographic type from the dropdown menu and then enter the corresponding FIPS codes.
- Click Next to navigate to the next page.
- From the Select tables dropdown, click on the search bar to select your tables.
For certain surveys, we have included both the original, unabridged dataset as well as the dataset we preprocessed with the most popular variables. You can choose which dataset you'd like to use for your reports by choosing the most suitable option in the Select dataset tab.
- Choose your desired dataset to access the data tables and select the ones you want to include in your report. Once done, click Add.
- Once you have chosen all of your specifications, click Create report.


We’ve also updated our premade reports to enable you to see which tables are part of a particular premade report. You can use premade reports as a bundle selection and then remove or add additional tables for your report.
Save a Report
- After you’ve created a report, click Save as in the top-right corner to save it.
- Type in the title and description of the report and hit Save.


You can access all of your saved reports by heading over to the My Projects tab on your dashboard.
Create a Template
You can now create and save custom-made templates to your Social Explorer account. With this new feature, you no longer have to reselect tables every time you create a report. You can save your desired list of tables as a template and return to it whenever needed. All of your saved lists will also be available on all comparable surveys.
- To create a template from your current report, click on More options in the report header.
- Click on Save list of tables to save your template.


Your saved template will only allow you to modify the year across comparable survey years and geographies.
You can access all of your saved reports by heading over to the My Projects tab on your dashboard.
Modify a Report
Switch or compare years
You can switch between the years available for your selected table or compare up to 3 years in one report. This allows you to change surveys while keeping preselected geographies and tables. You can also download the same report for different years in just a few simple clicks rather than creating a report manually for each individual year.
- Click on the
icon to modify your report.
- Click on the Survey year dropdown to switch the year or choose the years you wish to compare. You can select up to three.
- Click Apply.
- A new screen will appear showing you the percentage of geographies and tables that match your selected years. Click Confirm to continue.


Your report will now display data for your selected year/s. Please note that some geographies and tables may be missing for certain years due to insufficient data in certain tables. These will appear blank on your newly created report.
Modify geography and table selection
You can also modify your table and geography selections while viewing your created report. Simply click on the icon in the Tables or Geographies tab respectively to do so.
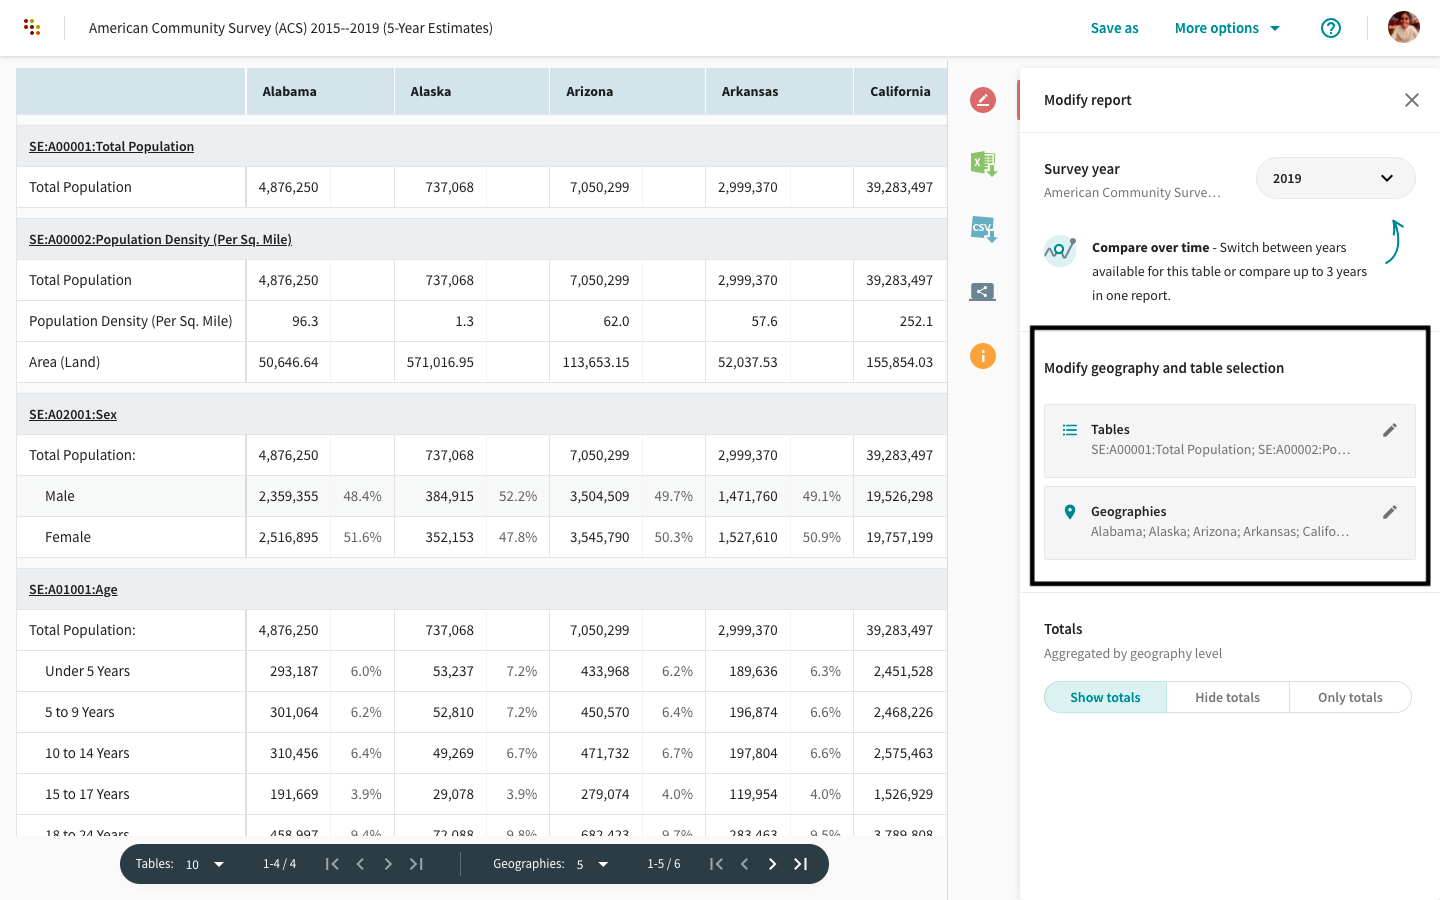
You can also customize how many tables or geographies you’d like to be displayed in your report with this toolbar:

Viewing totals
The totals are aggregated by geography level. You can choose to show or hide the Totals column or only display the cumulative total in your report.
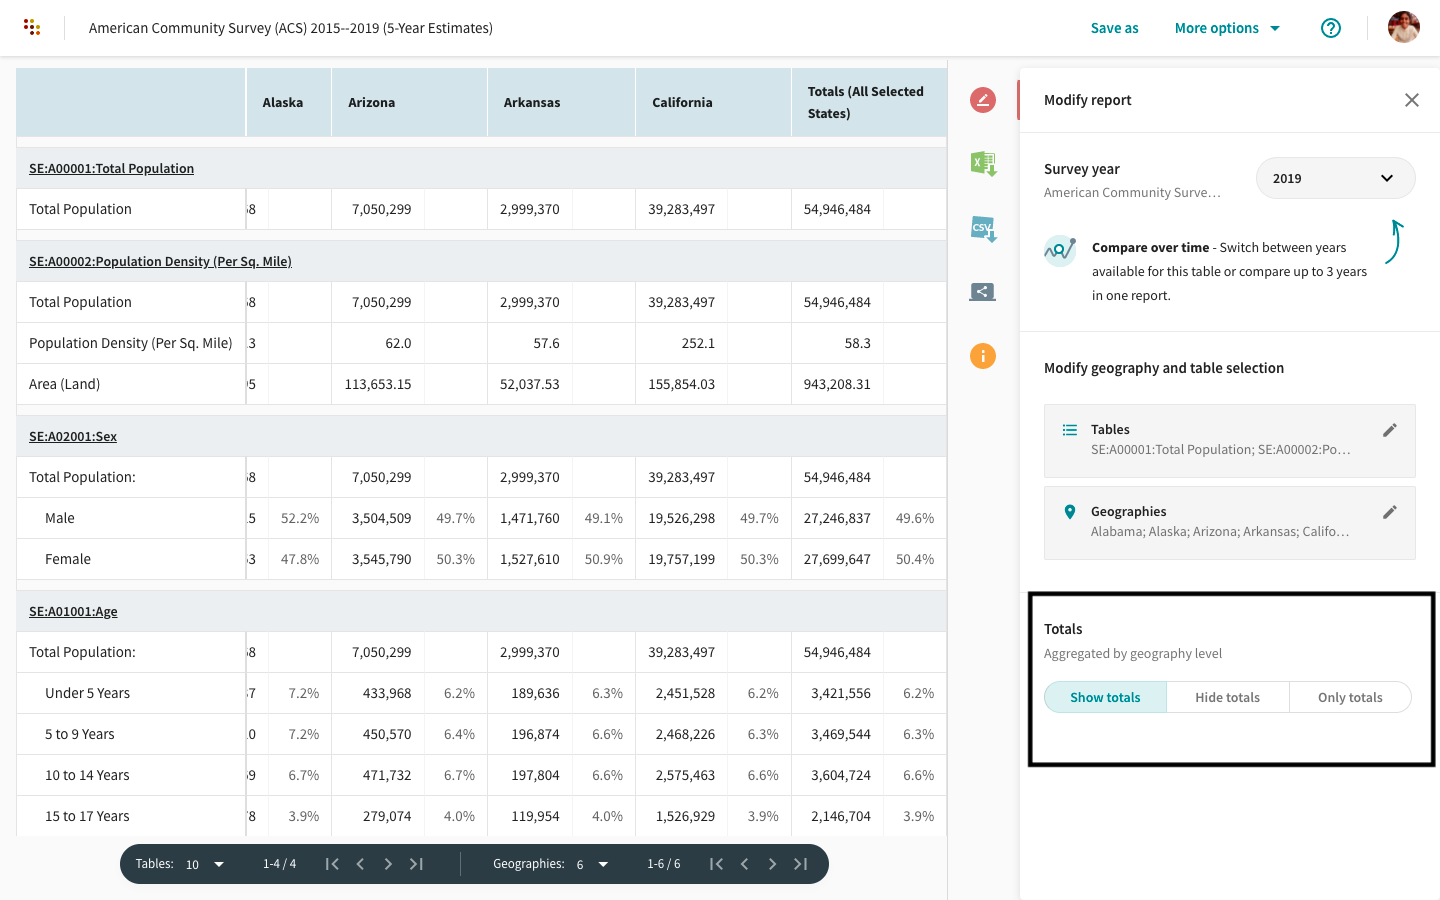
To find out how Social Explorer calculates medians in aggregate data, click here.
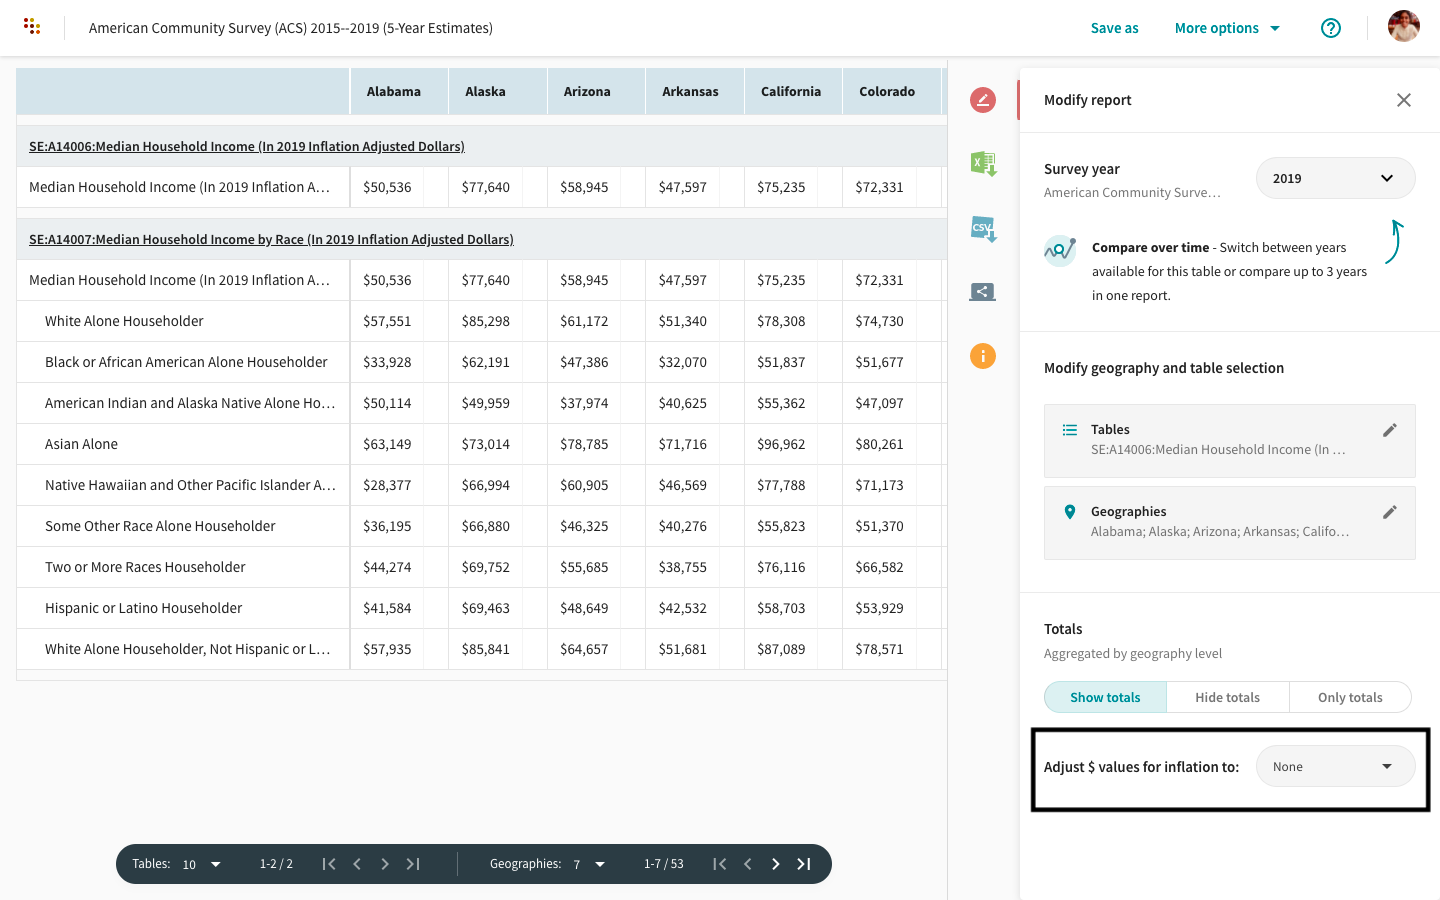
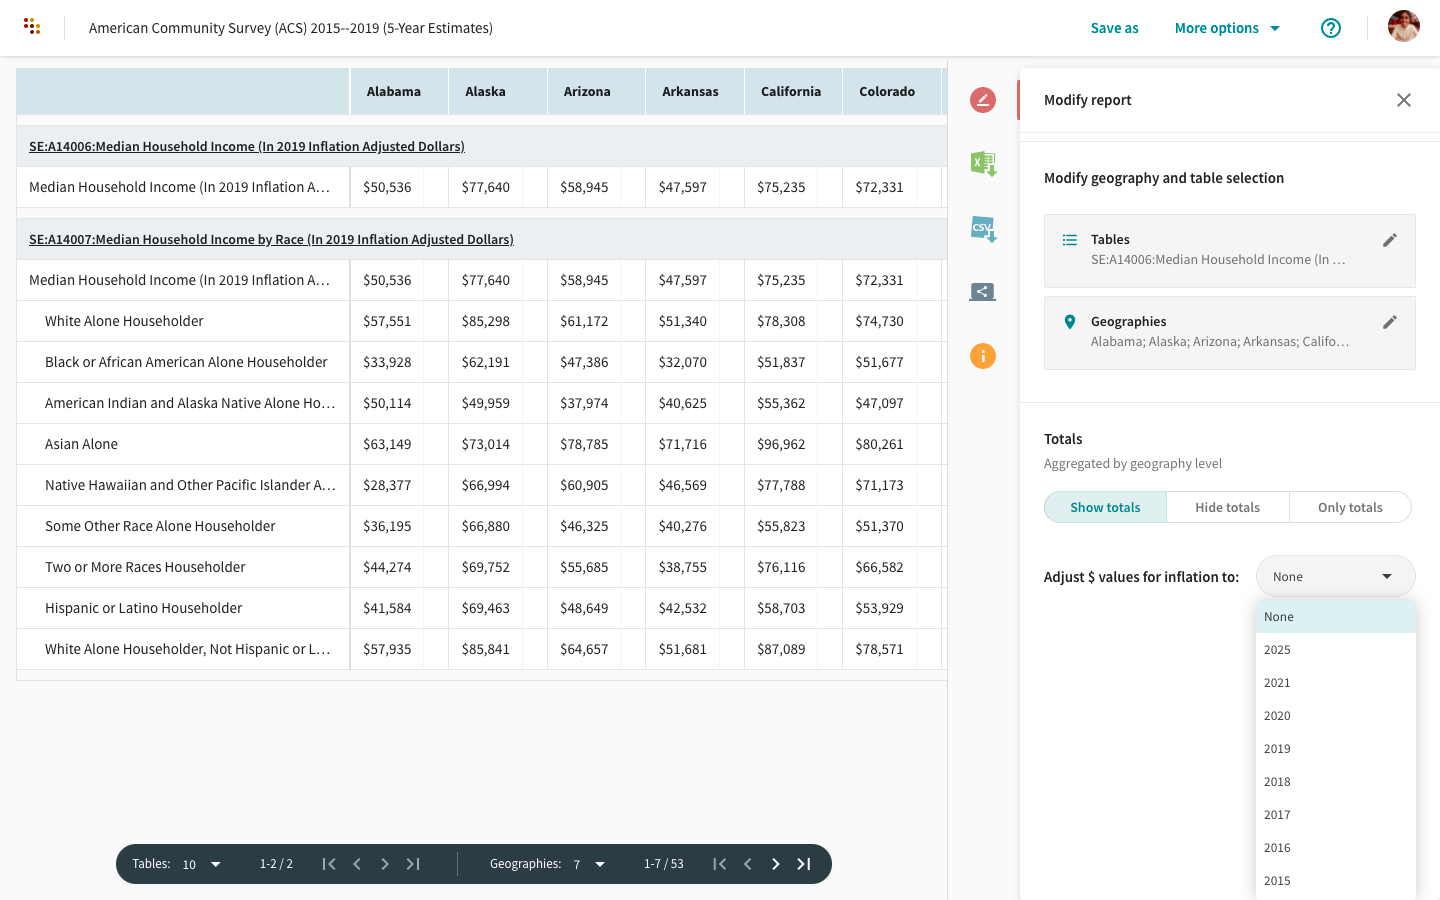
Adjust $ values for inflation
You can also adjust the dollar value for inflation before even downloading the report, output percentages, and totals, and tweak the formatting to suit your particular needs. This functionality is only available for money-related data, such as income, median home value, and gross rent from different years.
Read more about our methodology behind $ value inflation adjustment here.
Download your Report
Data downloads are available in the form of Excel, CSV, SAS, and SPSS files, which allows you to import your downloaded data into many software programs, including statistical packages, databases, spreadsheets, and GIS applications.
Download to Excel
Social Explorer allows you to download reports in Microsoft Excel format quickly and easily.
- Click on the icon.
- Click Download Excel to download your report.

Download a CSV file
You can quickly download any report to a CSV file.
CSV stands for Comma Separated Values, and it is a highly portable format that can be read by many software programs including statistical packages, databases, spreadsheets, and GIS applications. You can also open these files directly using Microsoft Excel or import the data into Microsoft Access.
- Click on the icon.
- Set your output options from the Download options dropdown. For instance, you can check the box next to 'Output ALL geographic identifiers' in order to download the geography labels.
- Once you’ve selected your download options, click on the
icon in the Download data by geography type menu to download the CSV file.


To download data for SAS, SPSS, and STATA, scroll down to the Download programs to import and label data menu. For STATA downloads, please select TAB delimited files in download options.
Share a Report
- Click on the icon.
- Click on Copy link to share.
 icon.
icon. 
Every report generates a unique Report URL which is saved forever and can be shared. Copy it from your browser URL address bar.
View Documentation and Data Dictionary
To help you better understand the data you are looking at, Social Explorer provides a data dictionary with documentation that you can access with a click.
- Click on the icon in the right-hand menu.
- The Info tab displays information regarding the data in your report, such as source and notes.
- Click on Documentation to access the relevant documentation for the data or select Data Dictionary to view all variables, sources, and technical documentation.

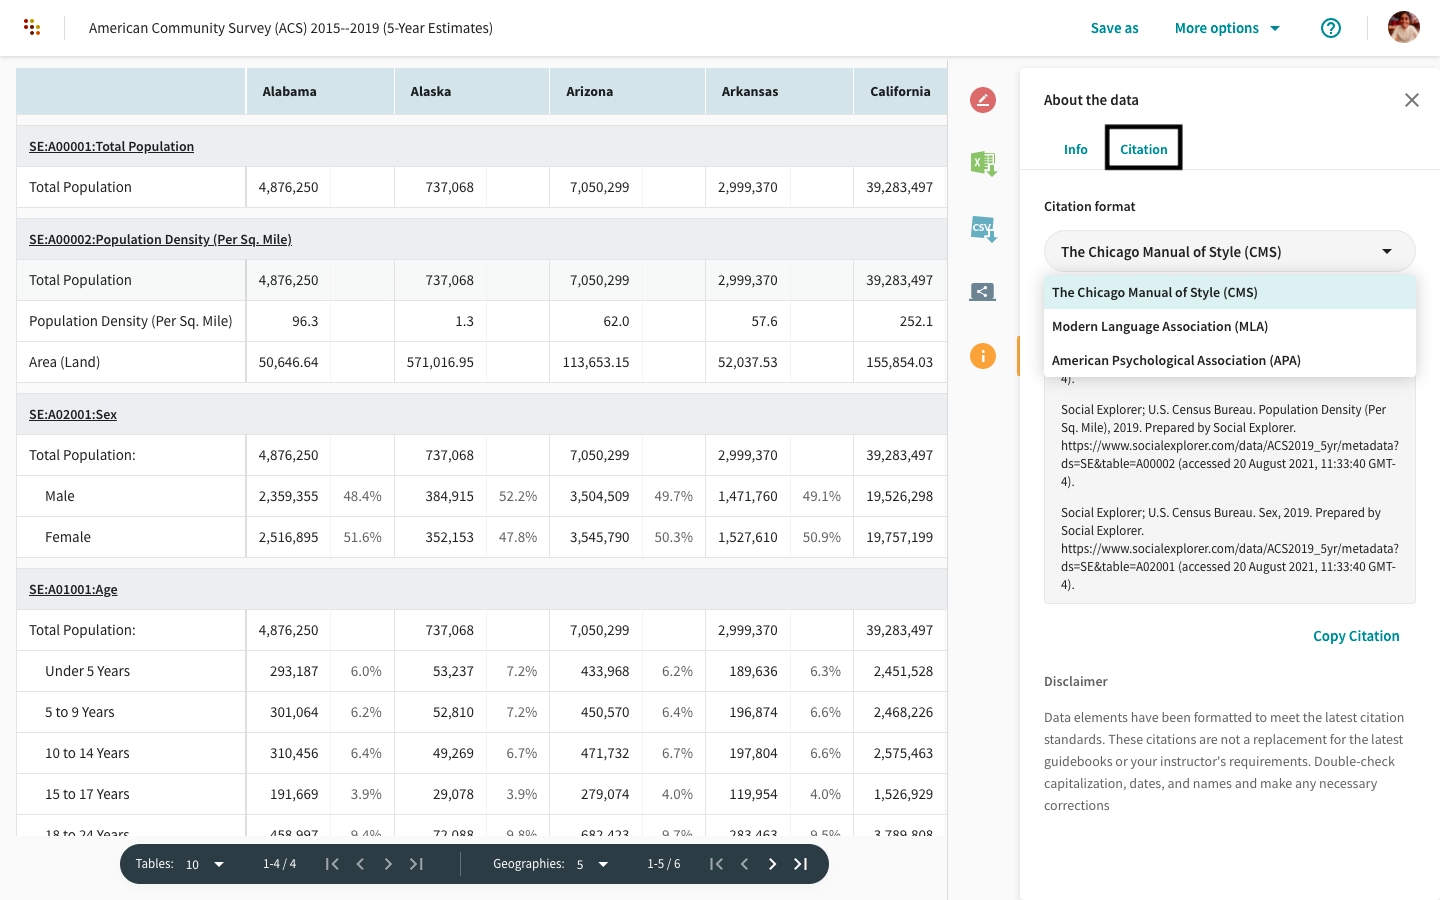
Use the Citation Tool
When referencing Social Explorer maps or reports in your research papers, simply use the citation tool to automatically generate citations in the following formats:
- The Chicago Manual of Style
- Modern Language Association (MLA)
- American Psychological Association (APA)
To learn how to cite Social Explorer reports, click here.