
Tens of millions of kids are already back in classrooms, while families in some states are still counting down to the first school dropoff. Social Explorer’s data and tools can help you examine school enrollment patterns and trends across the country and in your community.
According to the detailed 2024 American Community Survey (ACS) five-year estimates, 54,127,216 students were enrolled in K to 12 schools. All years and releases of the ACS are available in Social Explorer’s data library. Historical and current ACS data help users examine shifts in school enrollment by grades, location, sex, race, ethnicity, and more. The data are available down to the census tract level.
While the total U.S. population grew by 11.1% from 2009 to 2024, K to 12 enrollment grew by just 0.9%. In 2009, K to 12 students made up roughly 17.8% of the total population. By 2024 that share had slipped to approximately 16.2%, reflecting the nation’s aging population and declining birth rates.
Each school level cohort experienced different changes during that time span. Kindergarten enrollment numbers declined slightly (-0.6%) while enrollment in Grades 1 through 4 remained relatively flat (+0.1%) from 2009 to 2024. Grades 5 through 8 posted the strongest growth, adding roughly 348,000 students or 2.1%. Grades 9 through 12 saw a more modest increase of 0.9% or approximately 156,000 students.
State-by-State Enrollment:
Add detail to the national picture by taking a closer look at individual states and communities. The following map shows K to 12 enrollments by grade cohort across the country. Zoom in to view enrollment figures at county and census tract levels.
(Map numbers reflect counts of students. Map percentages are based on total population 3 years and older.)
State-by-state comparisons provide additional insight into school enrollment trends. The following table shows the 10 states with the largest K to 12 enrollments in 2024, and how these figures have changed from the 2009 ACS to the 2024 ACS.
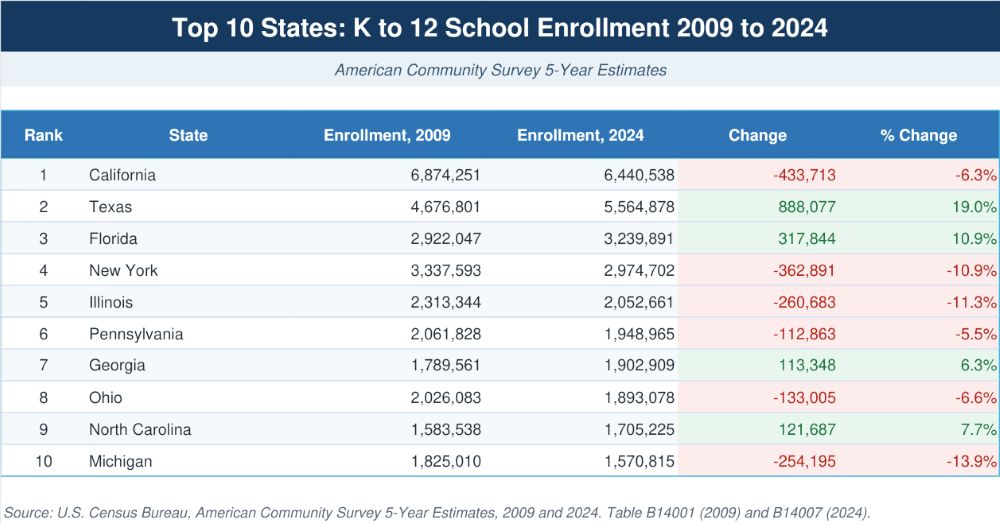
Among the top states with largest enrolled school children populations, Texas and Florida recorded substantial enrollment totals as well as strong growth from 2009 to 2024, according to the ACS data. Texas gained more students than any other state, adding 888,077 for an increase of 19.0%. This increase reflects the state’s strong overall population growth over the period.
Meanwhile, K to 12 enrollment figures remained high in California, New York and Illinois, even as all three states experienced declines. California recorded the largest numerical decline, losing 433,713 students, or 6.3%. New York also experienced a notable decline, losing 362,891 students or 10.9%, while Illinois enrollment fell by 260,683 students or 11.3%.
Several less populous states experienced the biggest boom in K–12 enrollment. North Dakota led all states with a 27.1% increase. The Mountain West states of Utah (+24.3%), Idaho (+22.5%), and Nevada (+22.5%) also recorded some of the nation’s largest percentage gains. Each of these states also experienced overall population growth well above the national rate. (For more on the regional and state shifts, check out our previous blog articles about GDP, household size, and family population growth trends.)
Get Back-to-School Ready with Social Explorer
From school supply retail forecasts to planning educational services, data and context can help planners, policymakers, researchers, grant writers, journalists, and others better understand school populations and their needs. Social Explorer offers the tools to examine these trends at the national, state, and local levels.
Let Social Explorer fill your bookbag with data and analysis this back-to-school season. New to Social Explorer? Sign up for a free Social Explorer account and try it today.