
The U.S. fertility rate reached an all-time low in 2024, according to data from the Center for Disease Control. This decline is part of a decades-long trend happening both nationally and globally. Social Explorer’s data and tools help researchers examine the larger patterns and also dig into the nuances community-by-community. What does the picture of U.S. population growth and decline look like? Which communities are bucking the trend? How are socioeconomic factors related to the changes? Build forward-looking analyses of the youngest among us with Social Explorer. This analysis will explore population growth areas and trends. A follow up analysis will examine related socioeconomic issues like affordability (childcare, housing, etc.).
Our analysis of age groups in the American Community Survey data from 2009 to 2024 documents the larger trends and the local differences. Focusing on the population under the age of five, the cohort has declined each year over this time period. Starting at 20.9 million in 2009, it dropped by roughly 2.1 million to 18.8 million in 2024. The steepest drops occurred in 2010 (−3.5%, a recession echo) and 2022 (−2.2%, a post-pandemic fertility dip).
Meanwhile, the country’s total population growth has been consistently positive, hovering between 0.4% and 1.0%, with a brief dip around 2020–2021 during the COVID-19 pandemic before recovering.
However, in some counties and cities, the under-five population has bucked the trend. A deeper analysis of the data helps document these communities experiencing baby booms and the in-migration of families with young children. The contrasts empower insights and further research questions.
The most remarkable growth in the under-five population occurred in small boom towns in rural America and the exurbs, as shown in the following table.
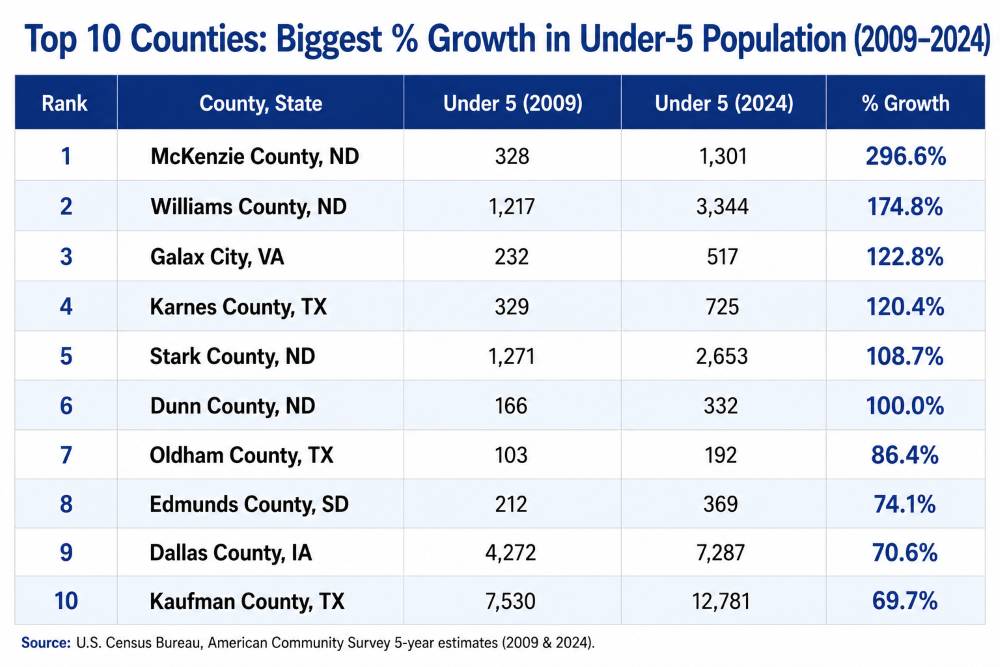
Though small in size, McKenzie County, North Dakota, leads by a wide margin at +297% growth in the under-five population, driven almost entirely by the Bakken oil boom, which drew large numbers of young working-age families into the region. Fellow North Dakota energy-sector counties including Williams, Stark, Dunn, Mountrail, and Bowman also topped the list of top under-five population growers. The Sun Belt region became home to more young families, including fast-growing Texas communities outside major cities, like Kaufman, Hays, and Chambers counties. (Because the populations of some of these counties are smaller, keep in mind that the ACS offers estimates. The data for this analysis come from the five-year ACS estimates, which offer a more reliable picture for small areas than single-year data.)
Dallas County, Iowa, located in suburban Des Moines, is the most populous county in the top 10, showing that rapid under-five growth is not limited to small boomtowns. In fact, Dallas County is the fastest growing county in all of Iowa. In recent years, Dallas County has also experienced increased median household incomes and educational attainment among its residents.
The following table of larger communities where the under-five population has grown counter to national trends, shows cities in multiple parts of the country.
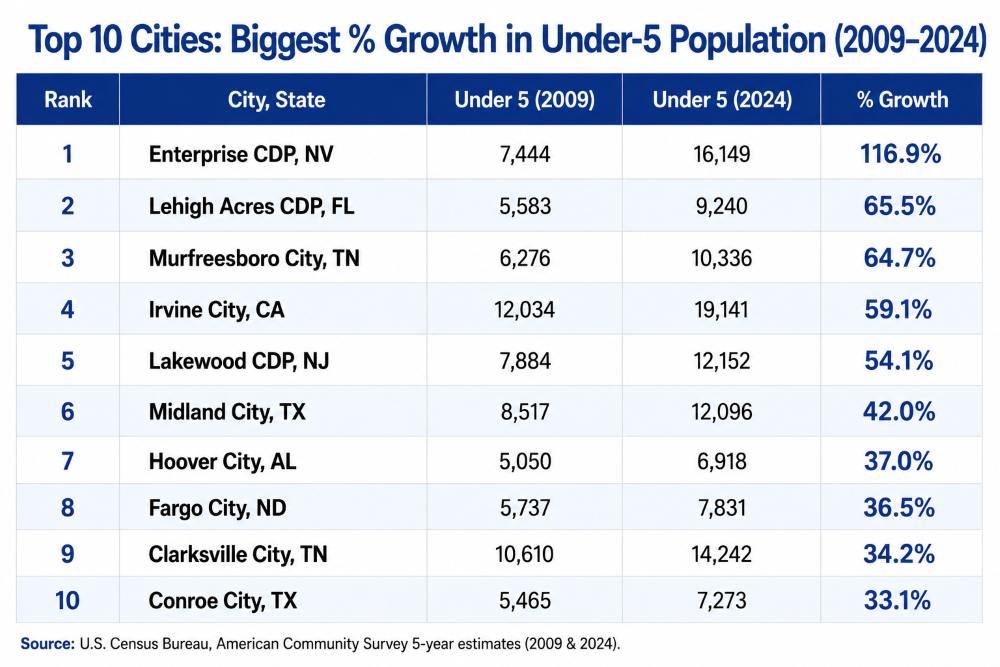
The unincorporated town of Enterprise, NV (a census designated place outside of Las Vegas) leads by a wide margin at +116.9%,. The community of Lehigh Acres, FL (Census Designated Place) (+65.5%) and Murfreesboro, TN (+64.7%) are the next strongest performers, both Sun Belt communities with strong in-migration. Irvine, CA (+59.1%) is the top California entry, reflecting continued family growth in Orange County. The Ocean County township of Lakewood, NJ (+54.1%) stands out as the only Northeast entry in the top five, driven by a rapidly growing Orthodox Jewish community. Midland, TX (+42%) reflects the Permian Basin oil boom drawing young working families. Fargo, ND (+36.5%) is the only Northern Plains city in the top 10, a consistent regional growth center. The Sun Belt states of Texas, Florida, Tennessee, and Nevada appear later on the list as well. Social Explorer helps spotlight communities of interest for researchers, who can examine unique socioeconomic traits with additional data from the American Community Survey or the many other data resources available in Social Explorer’s library.
Identifying New Growth Communities:
Where will more little Gen Alpha kids and emerging Gen Beta babies grow up? American Community Survey data on births can also help highlight which communities are experiencing new waves of growth (or declines). The following maps compare births in 2009 and 2024. The side-by-side study of women age-15 to 50 who had a birth in the past 12 months shows the change.
Counter to the national trend, five states saw a modest increase in birth rate between 2009 and 2024: Wyoming, New Hampshire, North Dakota, Montana and West Virginia. These states are all small-population, rural states, and the gains are modest (under 0.4% increase in birth rates). These changes may partly reflect demographic shifts such as in-migration of younger families or energy-boom effects (Wyoming, North Dakota, Montana).
Idaho and Utah, which had the highest birth rates in 2009, have in recent years seen the steepest declines (-2.1% and -2.0% respectively). Alaska (-1.3%), Texas (-1%), and Arizona (-1.1%) also saw large drops. Zoom in on the map to see the differences by states and counties over time. For further analysis, this birth data can also be broken down by age of the mother to gain more insight into teen pregnancy numbers, the trend of having children in later ages, etc. (15 to 19 years old, 20 to 24 years old, 30 to 34 years old, and so on).
Further Your Research from Baby Steps to Big Analyses:
Social Explorer empowers users to dive into American Community Survey data across years and geographies with a few simple clicks. Subscribers of any age can examine and compare growth trends and local insights. Add to your analyses with Social Explorer’s vast data library.
In future posts, we’ll examine how childcare, housing, and other factors connect with trends in young families and births across the U.S. Create your own analysis with Social Explorer’s maps and tools right now.
New to Social Explorer? Sign up for a free Social Explorer account to try it out today.