Create a report from a map
You can create a report right from the map application.
Create report from topic
- In the Change data menu, click the
 icon for More options.
 - Click Create report.
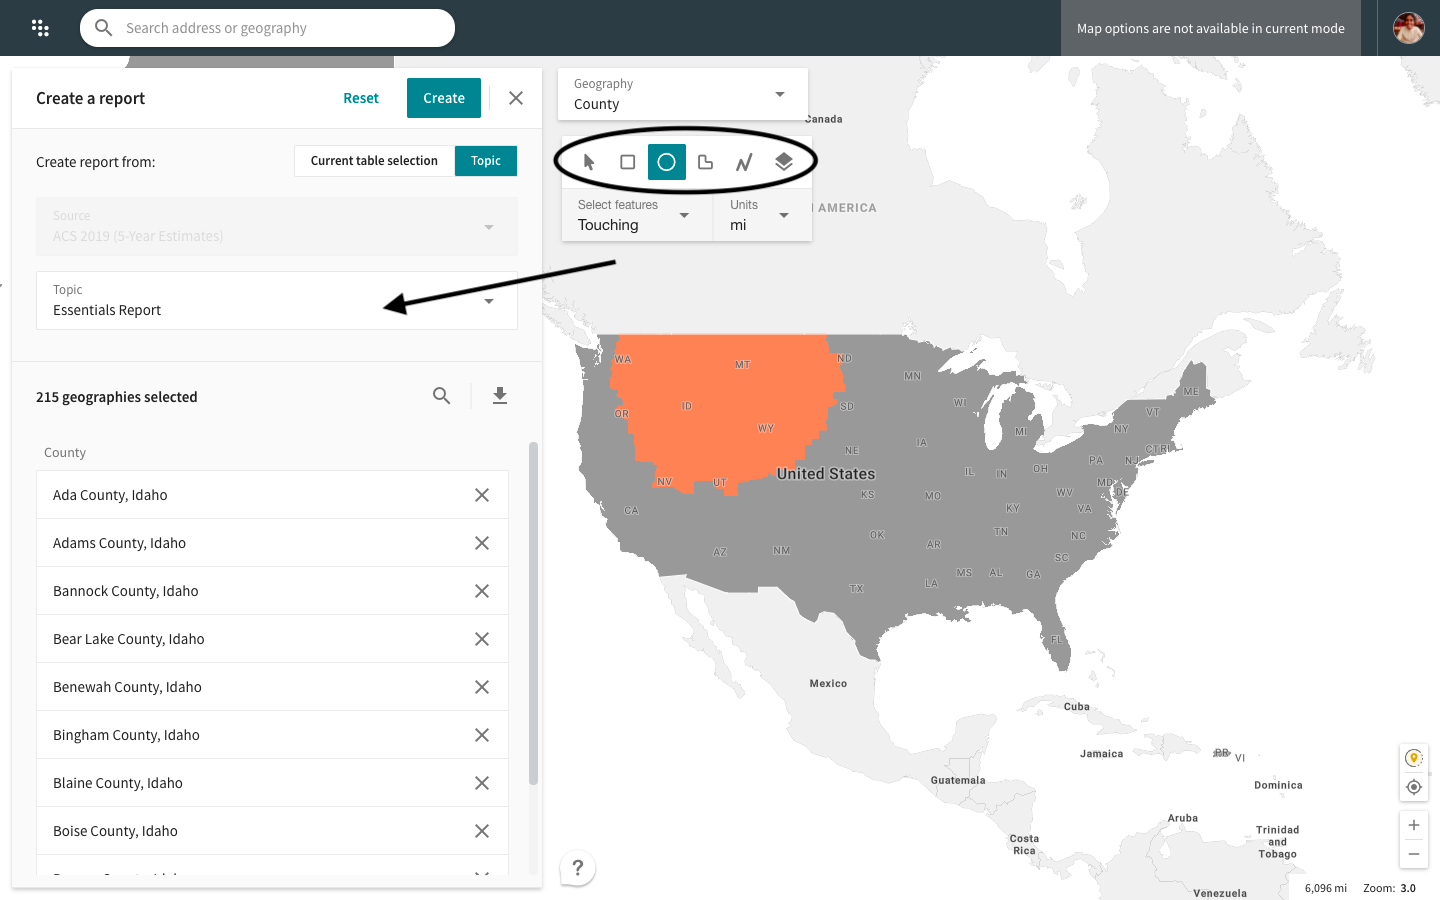
- In the left-hand sidebar, select the survey for which you want to create a report from the Source dropdown. Whichever survey you were most recently viewing on the map will be the default. You may switch to any other survey in the dropdown list.
- Select one of our premade reports or your saved templates from the topics dropdown. Choose the essentials or comprehensive report for an overview or a topical report, such as by age or race.
Note: You will be able to modify your report selections later as well.
- In the popup next to the Create a report panel, select the geography level you're interested in.
- Choose the geography selection tool at the top of the map.
Learn more about using our selection toolbox. We’ve also added a brand new tool to our geography selection toolbox, the layers tool
. Using this tool, you can select geographies from your uploaded datasets and easily create reports for those specific geographies in Social Explorer maps.
You can select geographies from different levels in a single report. Also, keep in mind that you will be able to edit your data and geography selections even after creating your report. Clicking the Reset button will clear all of your geography selections.
- Click Create.
 icon for More options.

Create report from selected table
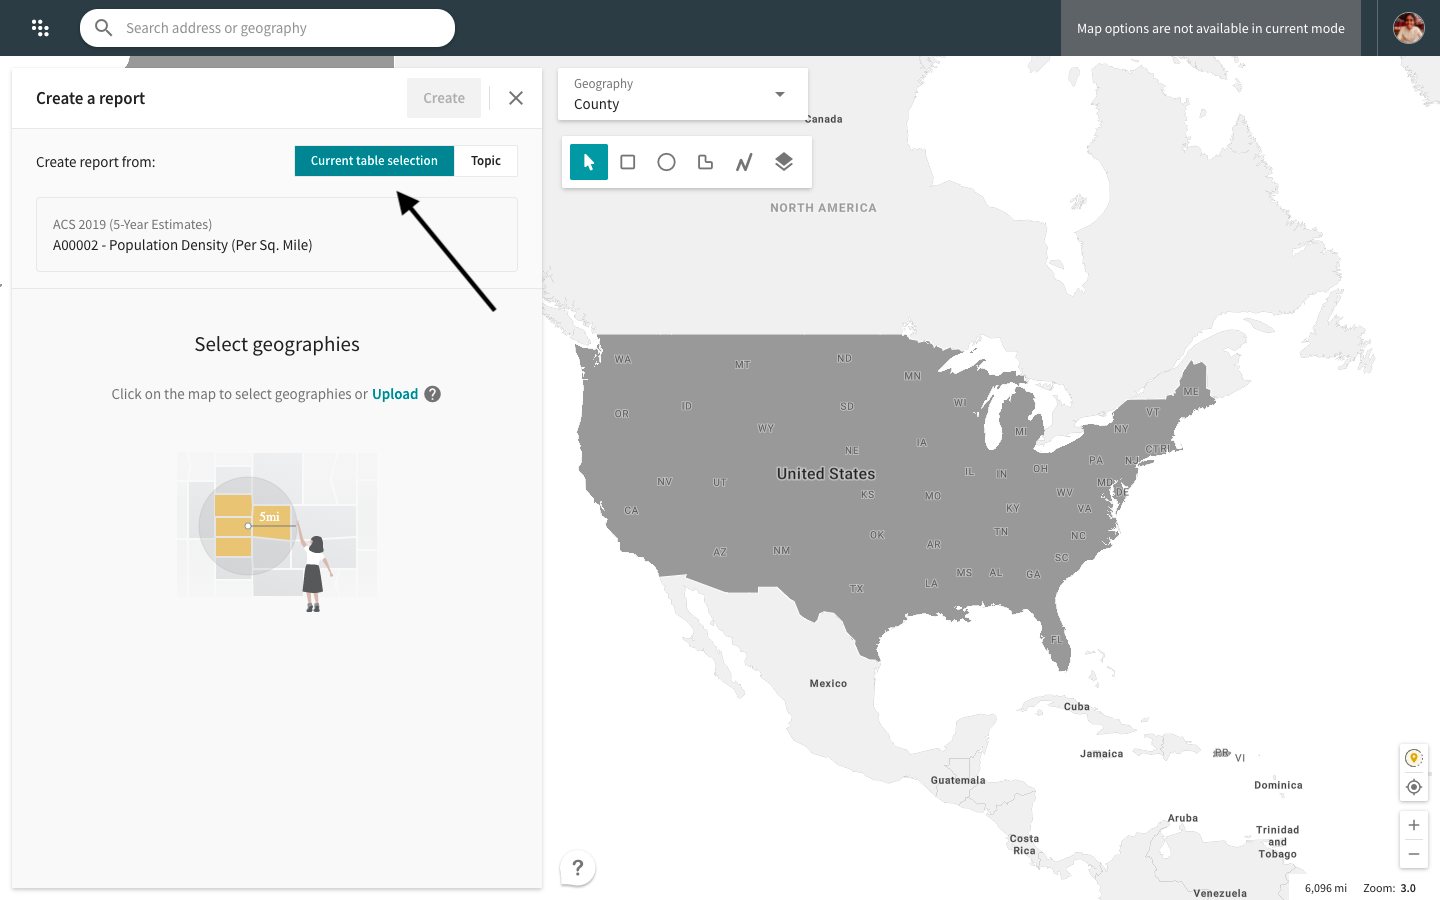
You can also create a report for whichever survey you were most recently viewing on the map.
- In the Change data menu, click the icon for More options.
- Click Create report.
- In the left-hand sidebar, switch to Current table selection.
- Repeat steps 5 to 7 to create a data report for the table you were most recently viewing on the map.
A more in-depth guide on creating reports from maps is available here.