Creating reports from a map
Social Explorer allows you to access a vast amount of data with just a few clicks. There are a couple of major ways you can do it: accessing the data only through reports and visualizing the data using maps. However, you can also create a report to get specific data for different geographies and variables right from the map application.
- In the Change data menu, click the
 icon for More options.
 - Click Create report.
 icon for More options.
 Selecting the survey
Social Explorer has over 800,000 data indicators from more than two centuries of American and global datasets.
- From the Source dropdown, pick the survey you're interested in. Let's say we want to explore Census 2010.
Whichever survey you were most recently exploring on the map will be the default, or you may switch to any other survey in the dropdown list. We have prepared a custom report with all the essential variables, as well as separate reports for the most popular variables from the survey you've selected. You will be able to modify your report selections later as well.
- Select the topic you want to explore. In our example, we selected Age.
Selecting the geography
- Select the geography level you want to explore the data for. Right now, State is the selected level, but you can select any from the levels included in the dropdown menu next to the Create a report panel.
Geography levels in the dropdown menu depend on the survey you've selected and may vary from survey to survey. Also, it's worth noting that you can select as many geographic areas as you need.
- Once you select the geography level you're interested in, there are different selection tools to select the area you want to explore. The rectangle, polygon, line, and circle selection tools help you select multiple geographies. Check out this guide to learn more about using our selection toolbox.
- Let's use the Square tool to select Montana, North Dakota, South Dakota, Wyoming, and Nebraska.
- You can also select different area types, whether it is just states, or a combination of states, counties, and census places, for example.
Let's add a few counties to our selection using the Point selection tool. The Point selection tool allows you to click on an area to add it to your selection. Unlike the Square and Circle tools, the areas you're selecting with the Point selection tool don't have to be adjacent to each other. - Switch to the Point selection tool and zoom in on the state of Texas until the county borders appear on the map.
You can also switch to County in the geography level dropdown without zooming in.
- Click Coleman County and Mills County to add them to our selected areas.
Removing a selected geography
To remove a geography from the list, simply click on the "X" next to its name. Or, click Reset to clear all selections (survey, report, and geography) if you want to start over.
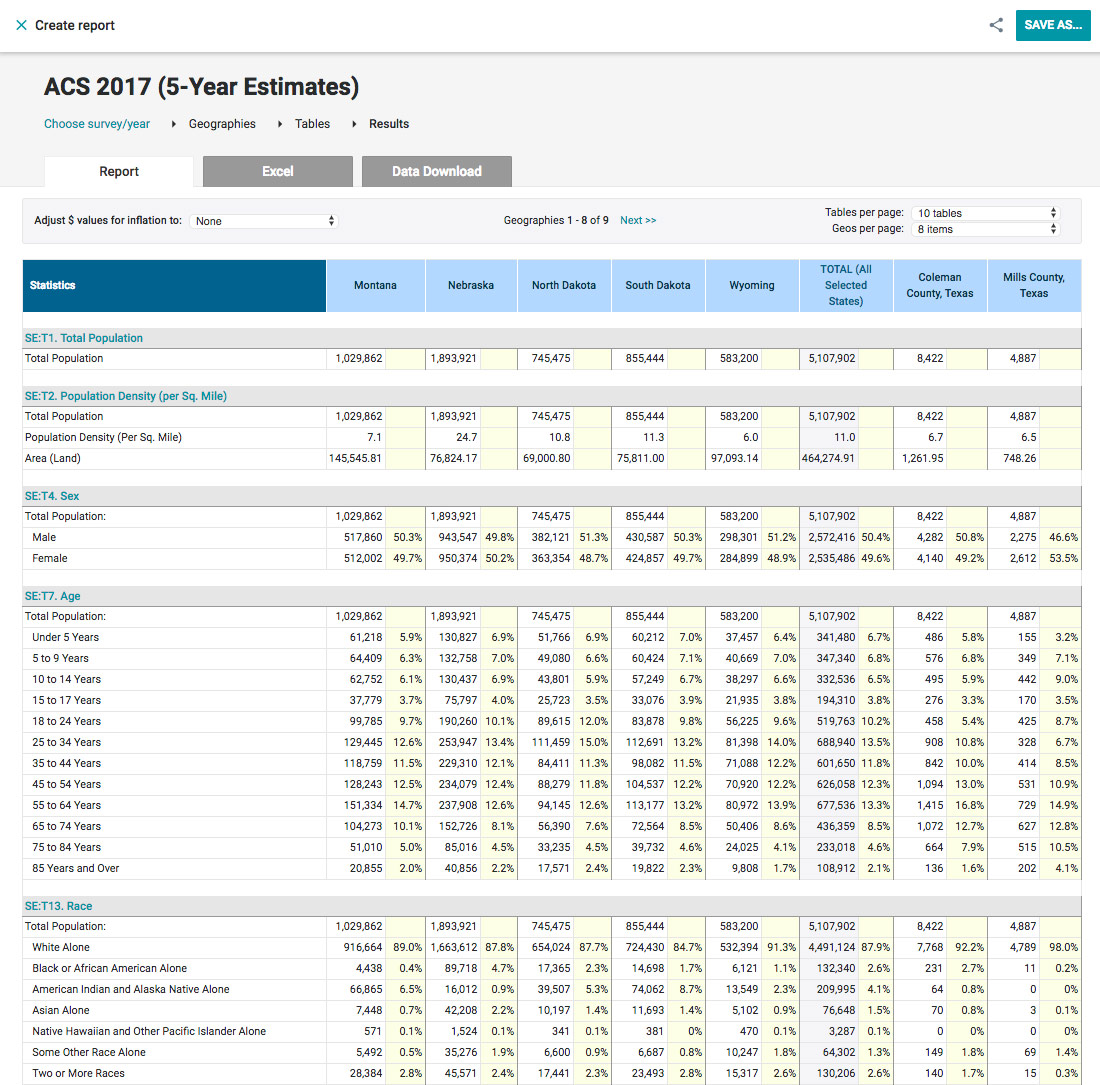
Creating your report
When you're done selecting the geographic areas you're interested in, click Create in the upper-right corner. Your report will open in a new tab. Keep in mind that you will be able to edit your data and geography selections even after creating your report.
Saving your report
You can save any report as a project quickly and easily. This allows you to come back to all of your saved reports and resume working on them.
- In the upper right corner of the Results page, click Save As…
- Enter the title and description.
- Click Save.
You can access all your saved reports by heading over to the My Reports page.