Exploring original tables from reports
Social Explorer provides its users with over half a million data indicators from sources such as the U.S. Census, American Community Survey, Eurostat, and many others. We are well aware of the complexity and range of data that we offer, so we prepare a set of tables with the most popular and used variables that the majority of our users usually look for. However, whenever possible, we include the original, unabridged tables with all the data as well. Let’s take a closer look at the ACS 2016 5-year estimates.
- Navigate to the Tables page.
- Click American Community Surveys (5-Year Estimates).
- Next to American Community Survey (ACS) 2012–2016 (5-Year Estimates), click Begin Report.
- Select the geographies you would like to examine, starting with the list of geographic types.
Adding geographies
You can add as many geographies as you want. Moreover, they do not have to be on the same level.
- Let’s select State from the geographic type dropdown.
- Select Oklahoma and New York. You can add them individually by clicking Oklahoma and then clicking Add, or by clicking Oklahoma and New York while holding the Control key on your keyboard.
- Click Add.
- Let’s go back to the geographic type dropdown menu and select Place. We have a new State field now because all the places are grouped by the state they’re located in.
- Let’s select Kansas from the State dropdown.
- Select Alta Vista city.
- Click Add.
You can also add geographies by their FIPS codes. Simply switch over to the FIPS Codes tab, select the geography level you’re interested in, and enter the FIPS code.
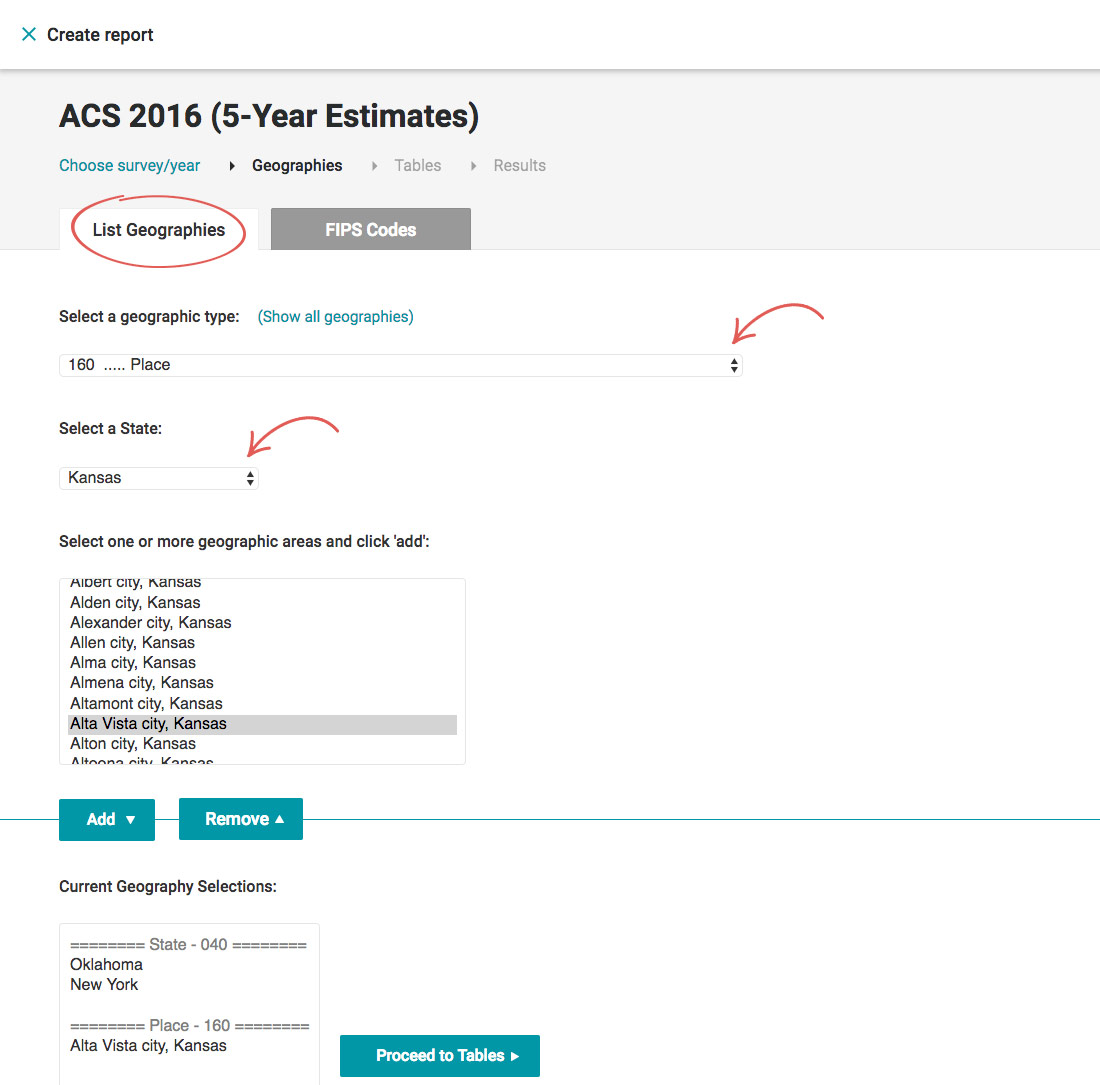
- Click Proceed to Tables when you’re done selecting all the geographies that you’re interested in.
Selecting variables
There are two options in the Dataset dropdown: Social Explorer tables and American Community Survey tables. If you want to access the tables we preprocessed, select the Social Explorer tables. However, let’s assume you want to access the entire original data.
- From the Dataset dropdown, select American Community Survey Tables: 2012 – 2016 (5-Year Estimates).
- Select the table you’re interested in. You can either scroll through the list, or switch over to the Search by Keyword tab and search for the variable that you’re interested in. We’ll go ahead and select Housing Units (B25001), and click Add. Remember, you can add as many variables as you want, just like with geographies.
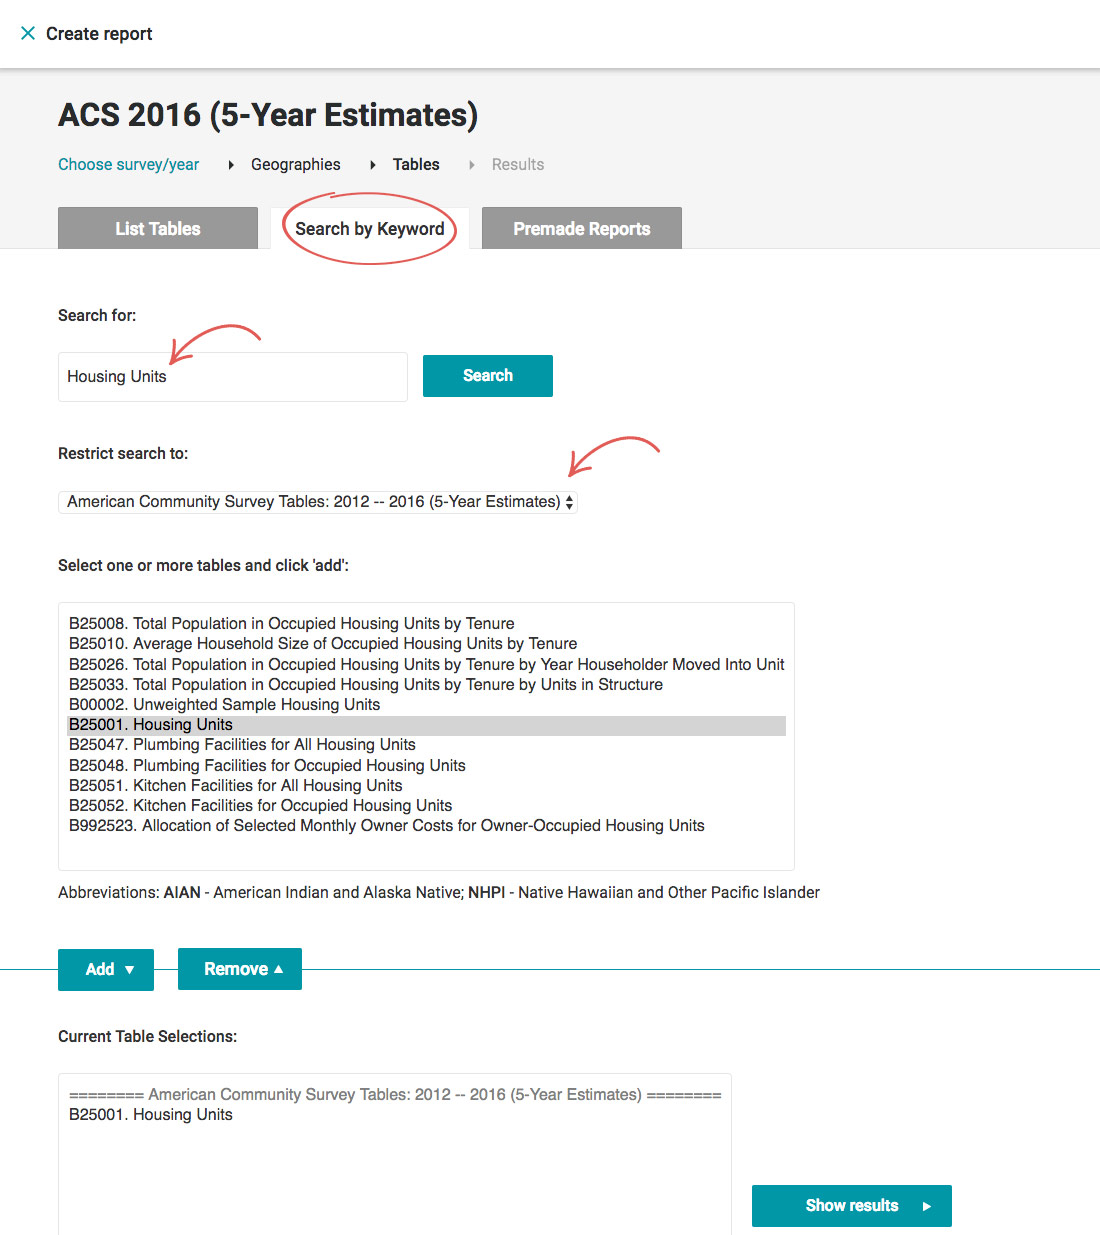
- Click Show results.
And there you have it! You just created a report using the original ACS tables for the geographies you’re interested in. You can save any report as a project quickly and easily. This allows you to come back to all of your saved reports and resume working on them.
- In the upper-right corner of the Results page, click Save As…
- Enter the title and description.
- Click Save.
You can access all your saved reports by heading over to the My Reports section.