Downloading and exporting data
This guide will help you get the most out of Social Explorer’s Reports and all the data that you have access to.
Reports made simple
Social Explorer was initially created as a data visualization tool. However, we quickly realized that our users needed something more than a visualization tool, which is when we introduced Reports. Reports is a simple way to access, filter, export, and download all the data. This comes in handy even for users who want to process data further in third-party software such as Excel.
Vast amounts of data – just a few clicks away
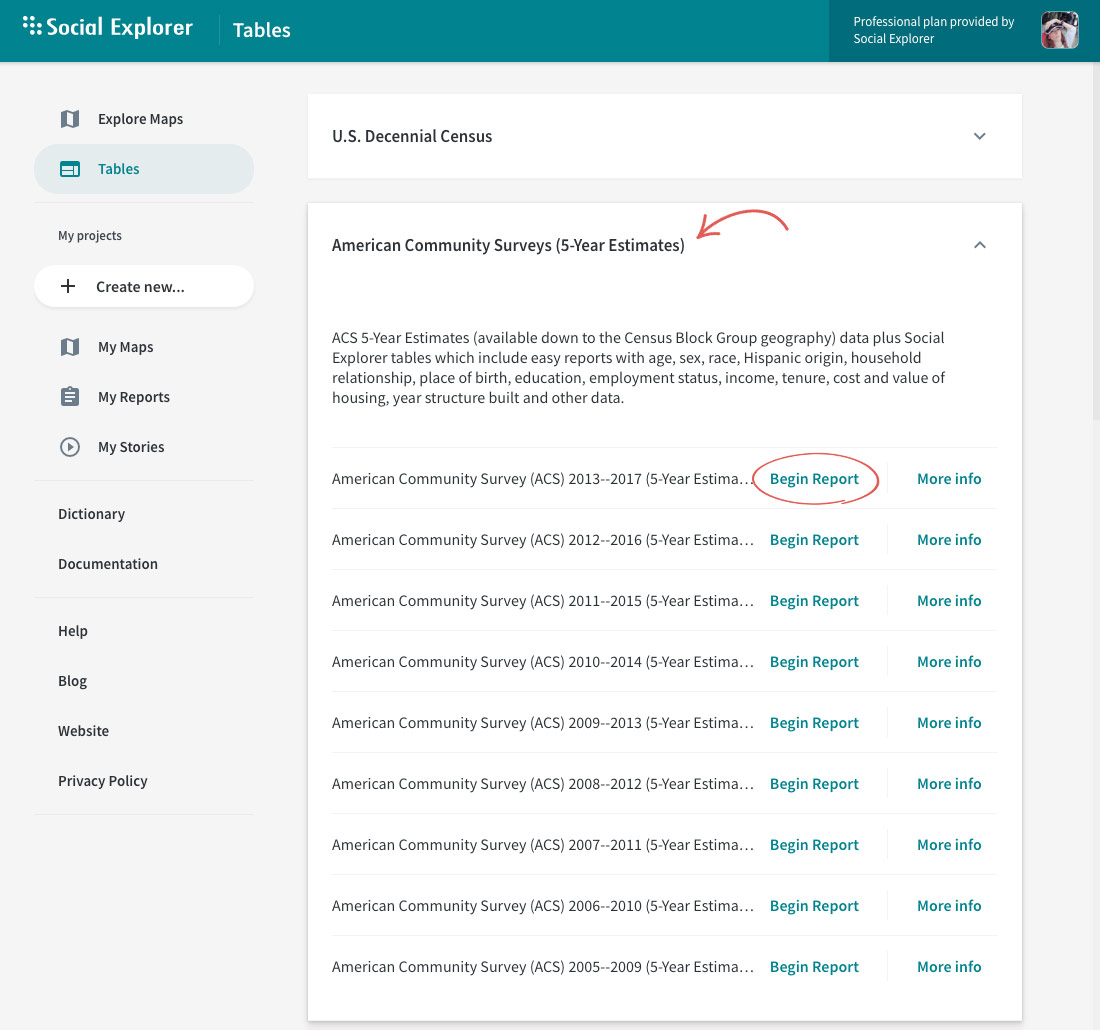
If you’re interested only in data, and not visualizing it, head over to the Tables page. You can access all the U.S. Decennial Census data, as well as American Community Surveys, Business Patterns, Crime, Health, and Religion data, UK and Canadian Census data, and even World Development Indicators, among others.
Let’s say you want to compare poverty in the African-American and Caucasian population.
- Select American Community Surveys (5-Year Estimates).
- Next to American Community Survey (ACS) 2014–2018 (5-Year Estimates), click Begin Report.
Selecting the right geography
There are a couple of ways you can select the geographies you’re interested in: from a list of geographies or by FIPS codes.
Selecting geographies from a list
Social Explorer allows you to select multiple geographies. Moreover, you can also select different types of geographies. This means you can select a couple of states, a dozen counties, and add in a few tracts for good measure. But let’s keep it simple for now.
- In the Select a geographic type: dropdown, select State.
- Select New York.
- Click Add.
You can repeat these three steps as many times as necessary until you’ve selected all the geographies that you’re interested in adding. You can also double-click on the geographic areas to add it to your selection without having to click Add.
And lastly, you can select multiple geographies at the same time:
- Click the first geography you want to select while pressing the CTRL key.
- Click the next geography you want to add to your selection while still holding CTRL.
- Click Add.
Selecting geographies by FIPS codes
- At the top of the screen, select the FIPS Codes tab.
- Select the geography type you're interested in from the dropdrown menu.
- Enter FIPS codes for one or more geographic areas and click Add.
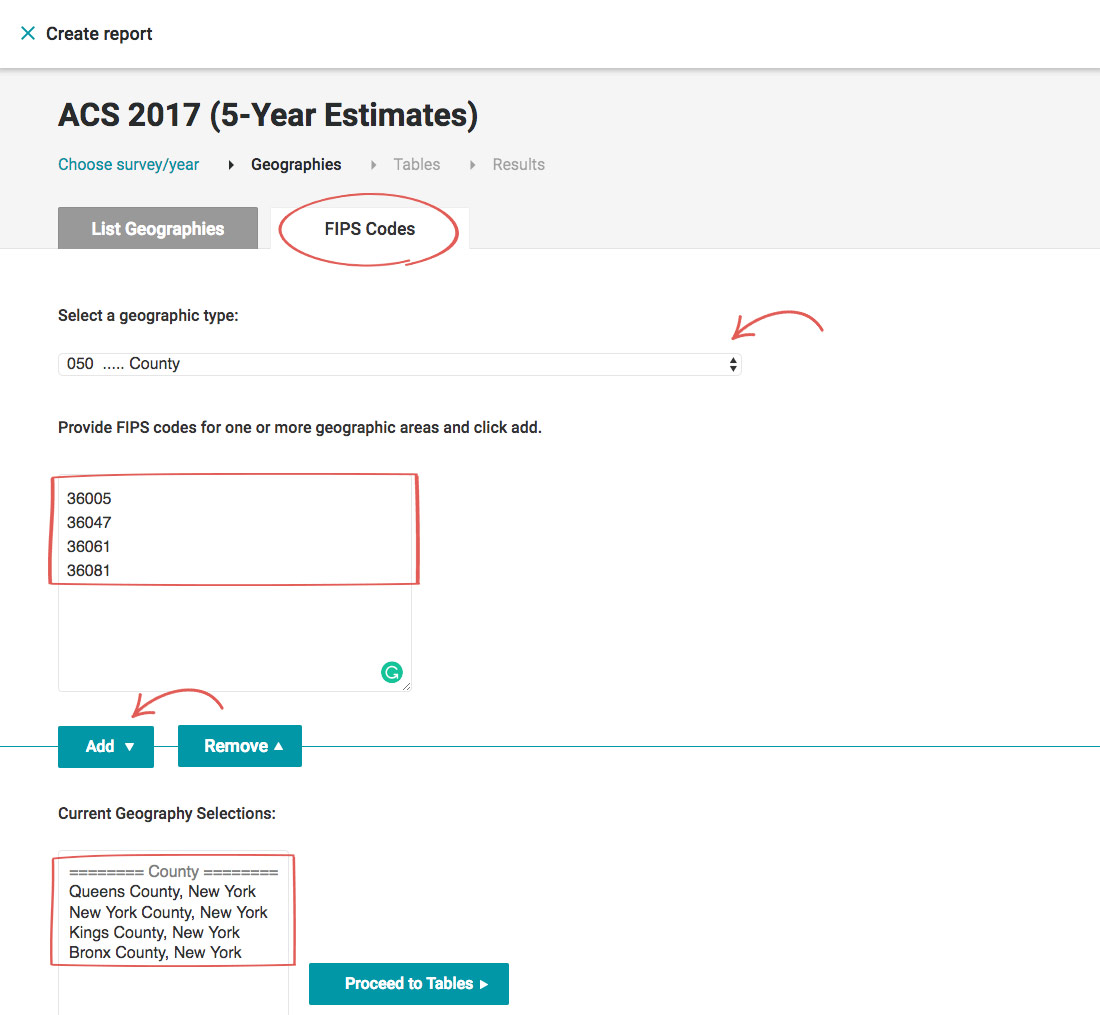
Removing a geography
If you add a geography by mistake, simply select it in the Current Geography Selections: field and click Remove. When you’re done selecting the geographies, click Proceed to Tables.
Selecting the variables
Here’s where the fun part starts: selecting the variable. Just like with the geographies, you can select as many variables as you want, but let’s keep it down to poverty in the African-American and Caucasian population.
There are three ways you can find variables in Social Explorer: in a list, searching by keyword, or using one of the premade reports.
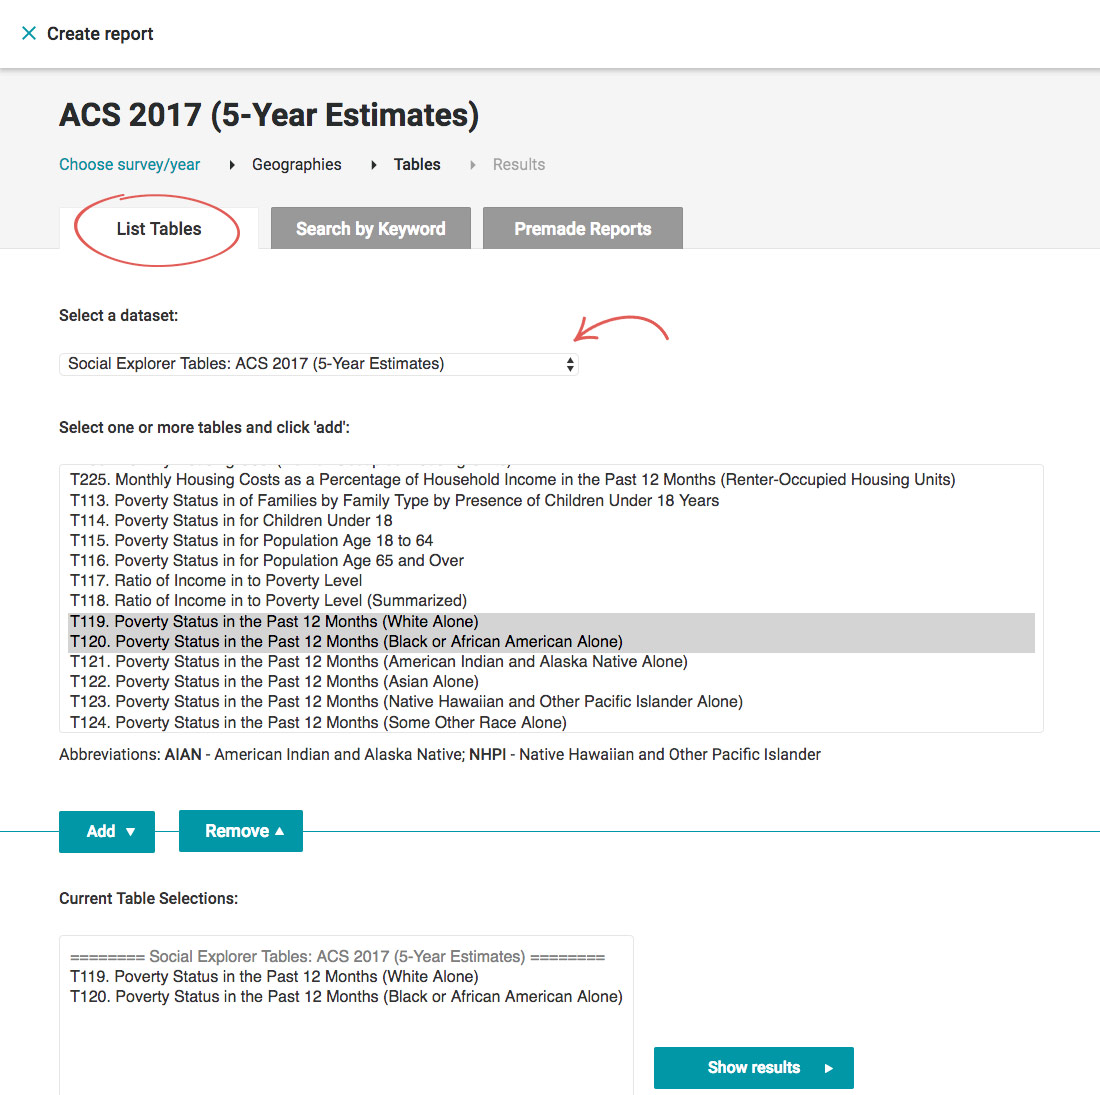
Selecting variables from the list
Here at Social Explorer, we are well aware of the complexity and range of data that we offer our users. This is why we prepare a set of tables with the most popular and used variables which a majority of our users will find useful. However, whenever possible, we also include the original, unabridged tables with all the data.
There are two options in the Dataset dropdown: Social Explorer tables, and American Community Survey tables. If you want to access the tables we preprocessed, select the Social Explorer tables.
- Scroll down and select Poverty Status in the Past 12 Months (White Alone).
- Click Add.
- Select Poverty Status in the Past 12 Months (Black or African American Alone).
- Click Add.
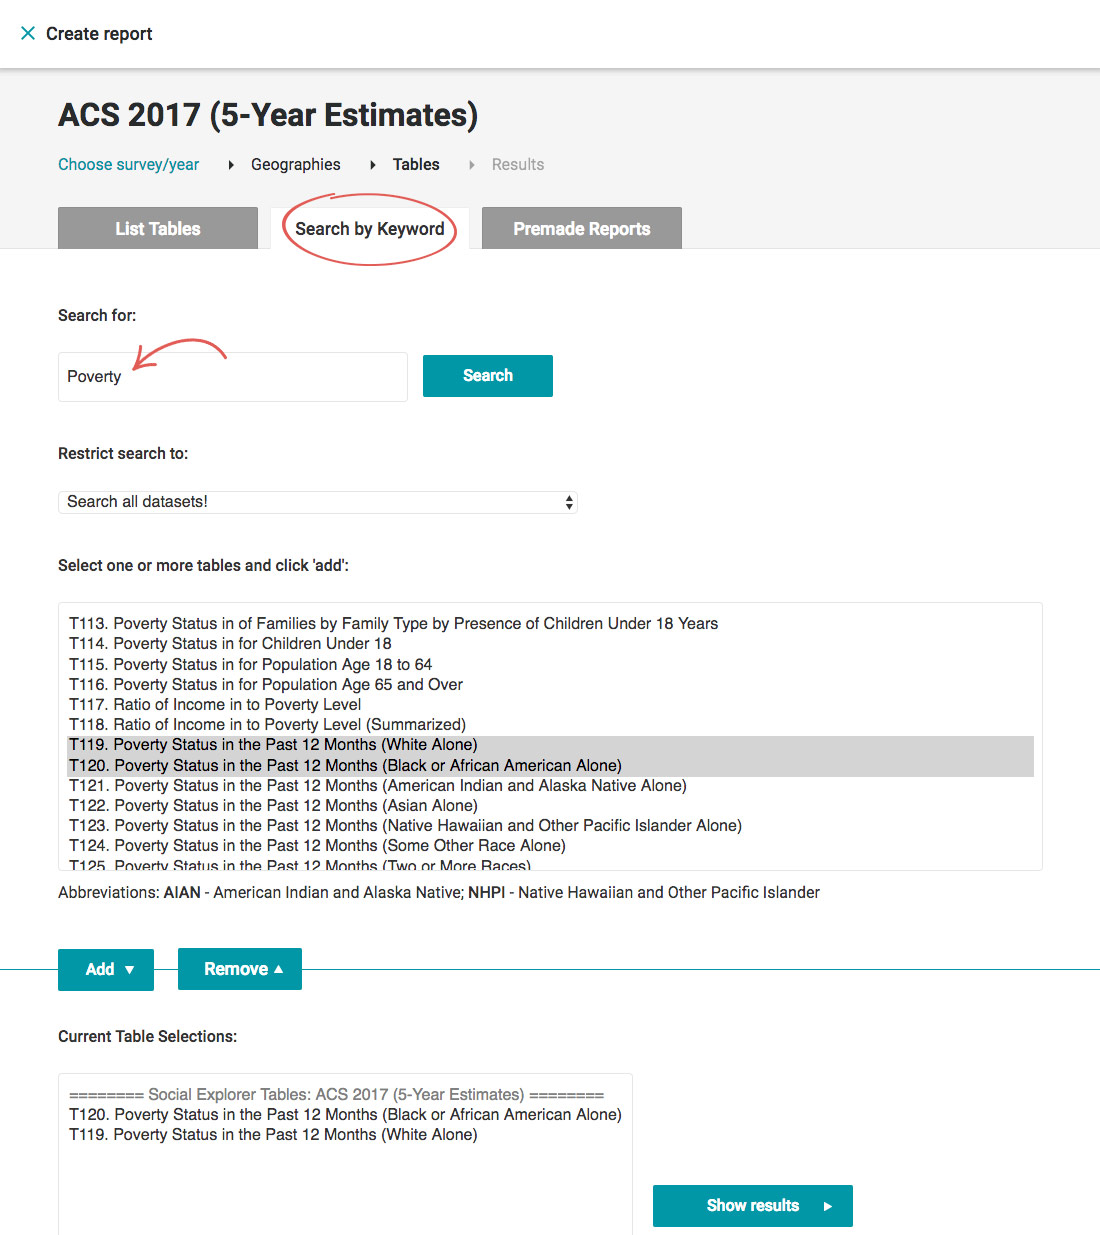
Selecting variables by searching by keyword
If you don’t feel like scrolling through the list of all the variables in the table, you can do a quick search by keywords.
- Switch to the Search by Keyword tab.
- Type Poverty in the search field.
You can restrict the search to the original unabridged tables, Social Explorer tables, or search all tables.
- Click Search or hit enter.
- Select Poverty Status in the Past 12 Months (White Alone).
- Click Add.
- Select Poverty Status in the Past 12 Months (Black or African American Alone).
- Click Add.
Using our premade reports
In addition to including the original tables and the abridged Social Explorer tables, we have prepared a few ready-to-use reports containing the most popular variables.
- Switch to the Premade Reports tab.
- Select Poverty.
- Click Add.
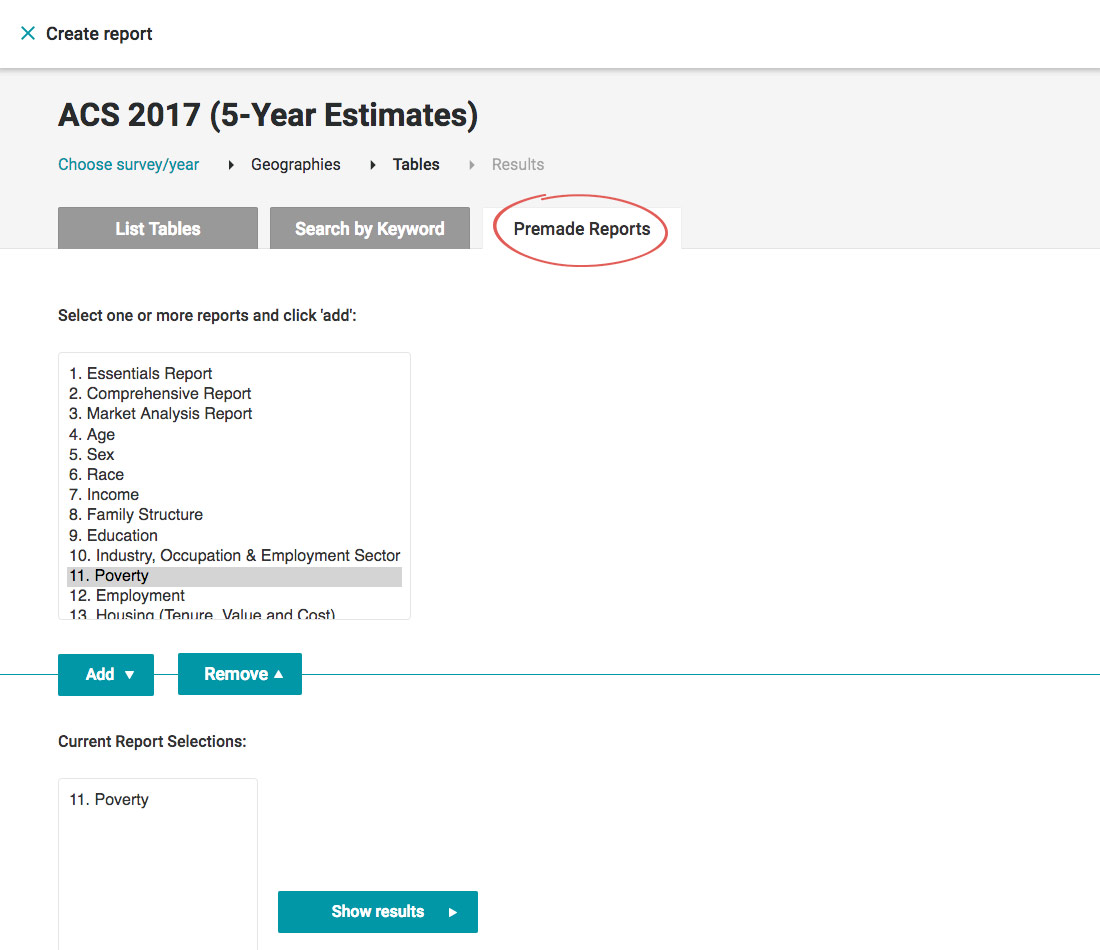
Once you’ve selected all the variables that you’re interested in, click Show results.
Get more out of your reports
We’re aware that your work is just beginning when you create a report, which is why we've added a few different options, whether you want to save your report or download it.
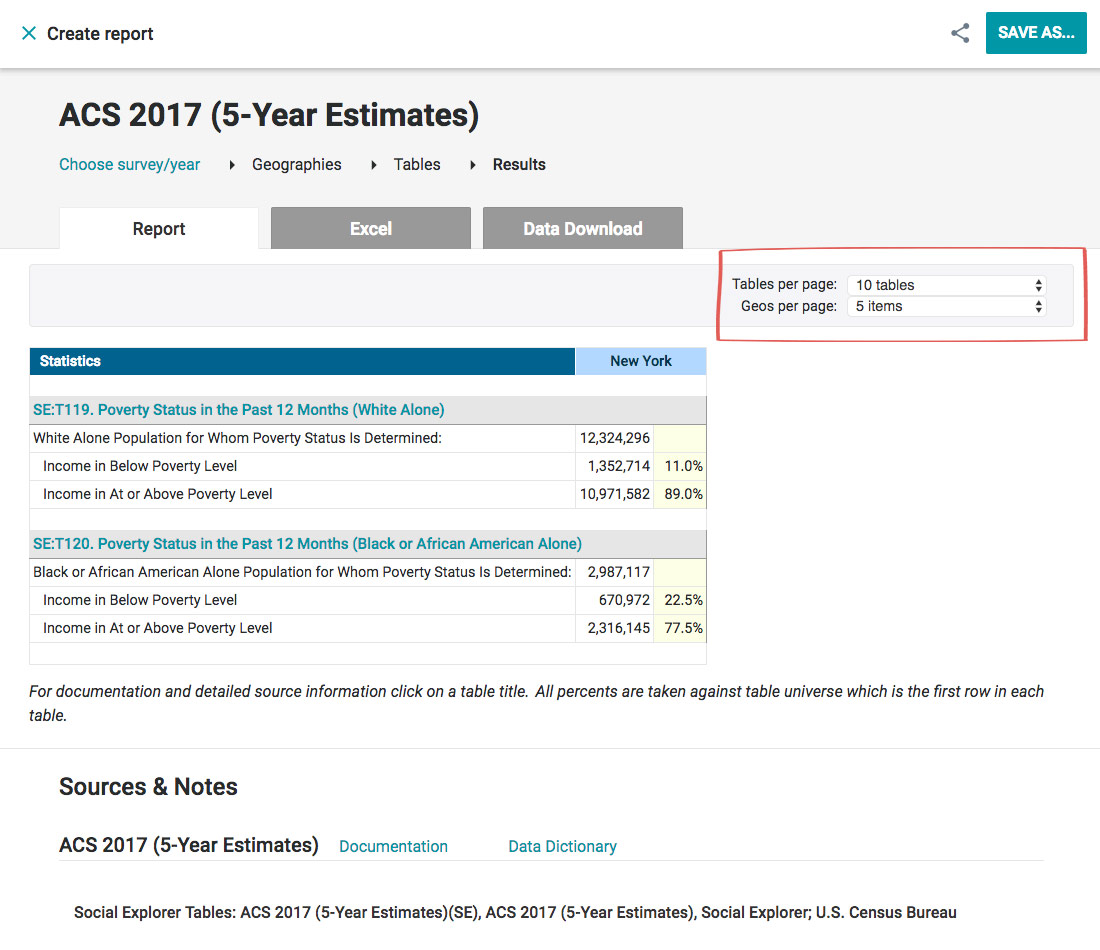
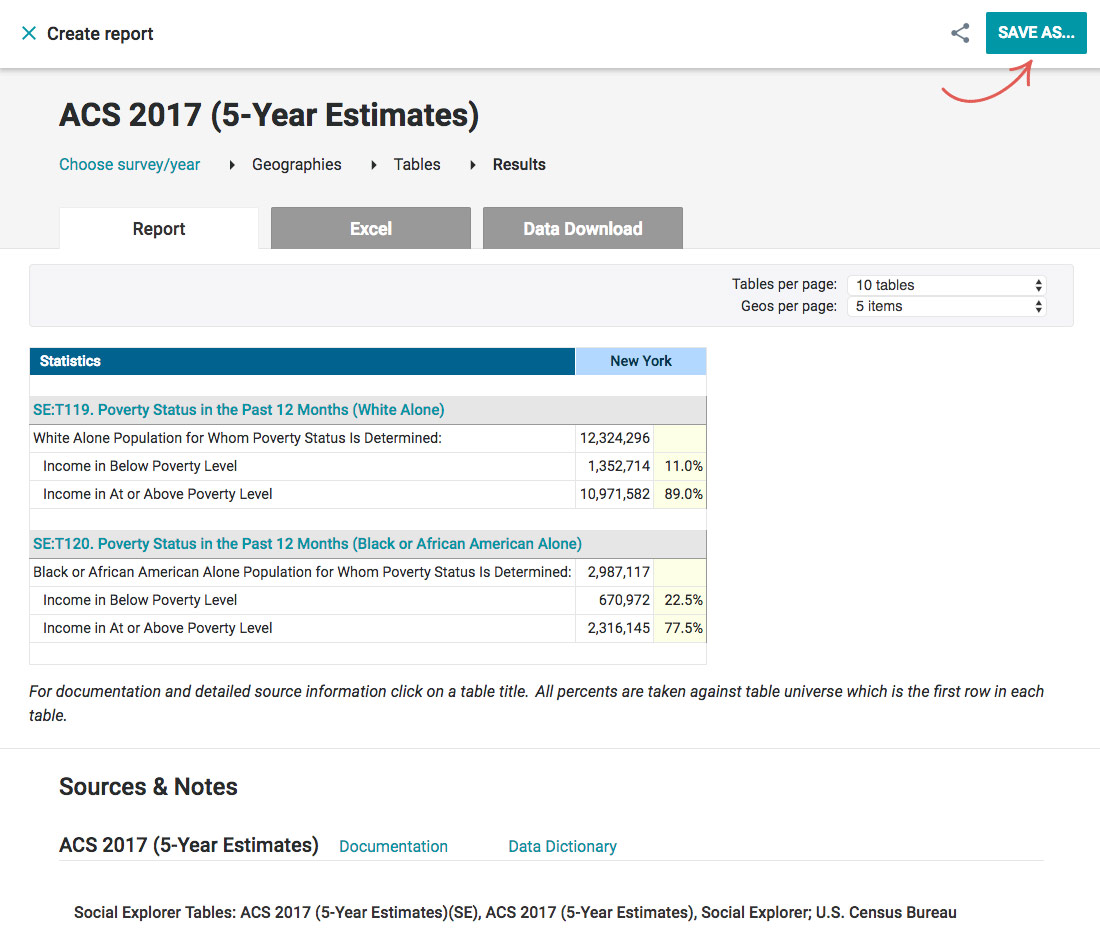
Viewing your report
You’re automatically taken to the report that you created. In our example, the entire report is displayed on a single page. However, if you select multiple geographies and variables, they might end up being displayed on multiple pages. However, Social Explorer allows you to customize the report view.
There are two dropdowns on the right-hand side, above the report. These allow you to manually set the number of tables, as well as geographies per page. You can display up to 100 geographies and 50 tables per page.
You can find quick links to Documentation and Data Dictionary right below the report you’ve just created. These links will take you to the documentation and dictionary of the survey you’ve selected in the first step.
Download to Excel
Social Explorer allows you to download the report as a Microsoft Excel file. Two versions of Excel are supported: 2007 and 2003.
Versions prior to Excel 2007 are limited to 255 columns and 65,535 rows, per sheet. For these versions, if you select more than 255 geographies, they will be output on separate sheets. You may also choose to output just the totals.
- At the top of the report, click the Excel tab.
You can adjust dollar values for inflation where applicable by selecting the year from the dropdown menu.
- Select the output options you want to include in your download.
You can set the formatting options if you wish.
- Click the icon corresponding to the Excel version you want to use.
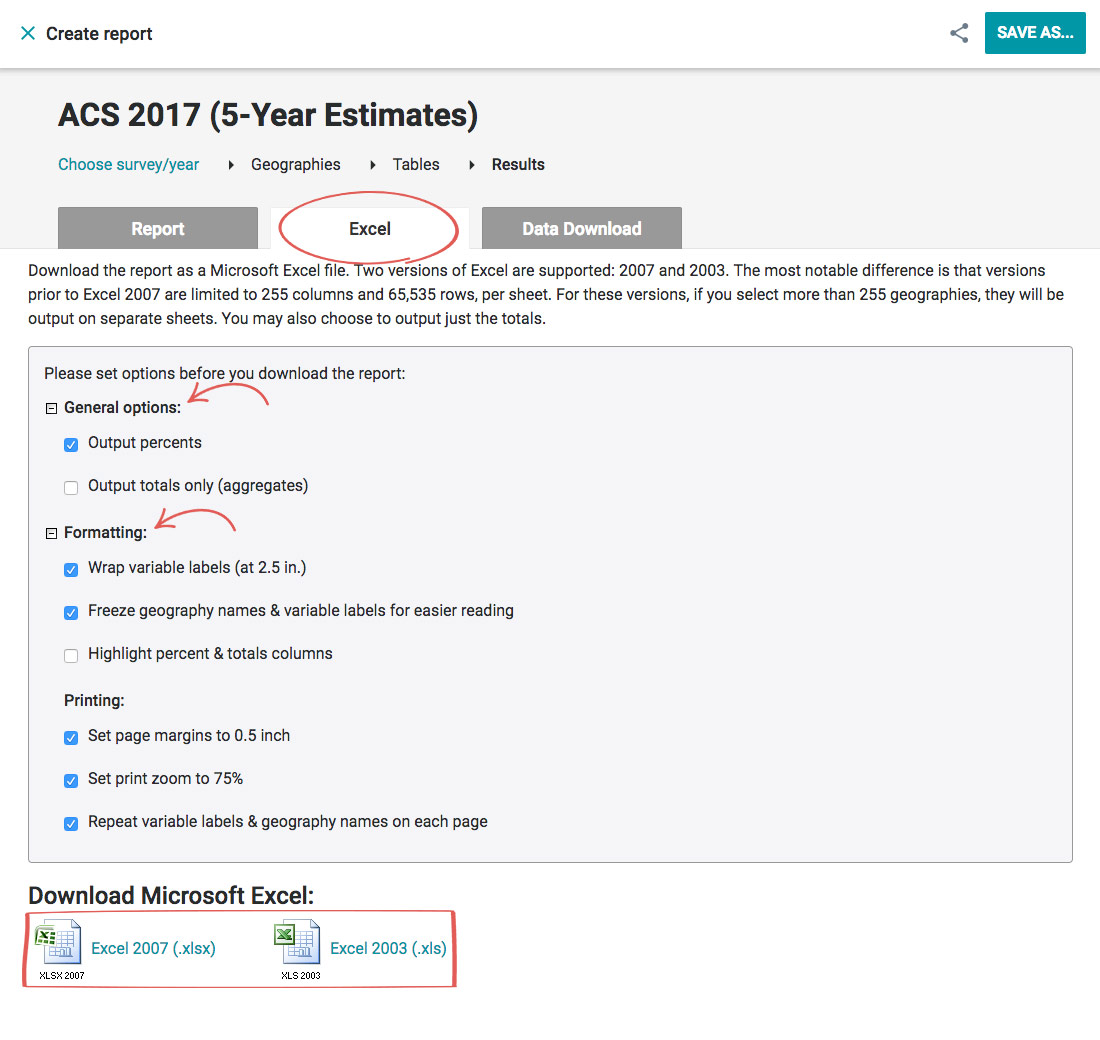
Depending on your browser settings, you might be prompted to select the folder on your computer where you want to save the file. If this is the case, simply navigate to the folder where you want to save your report, and click Save.
Download data as CSV
In addition to saving reports as Excel files, you can quickly download them as CSV files. CSV stands for Comma Separated Values, and it is a highly portable format that can be read by many software programs including statistical packages, databases, spreadsheets, and GIS applications. You can also open these files directly using Microsoft Excel or import the data into Microsoft Access.
- At the top of the report, click the Data Download tab.
You can adjust dollar values for inflation where applicable by selecting the year from the dropdown menu.
- Select the output options you want to include in your download.
- Click the name of the CSV file to download it. In our case, it’s State data (CSV).
If you select more than one geography level, such as state and census tract, you will need to download separate CSV files for each geography level.
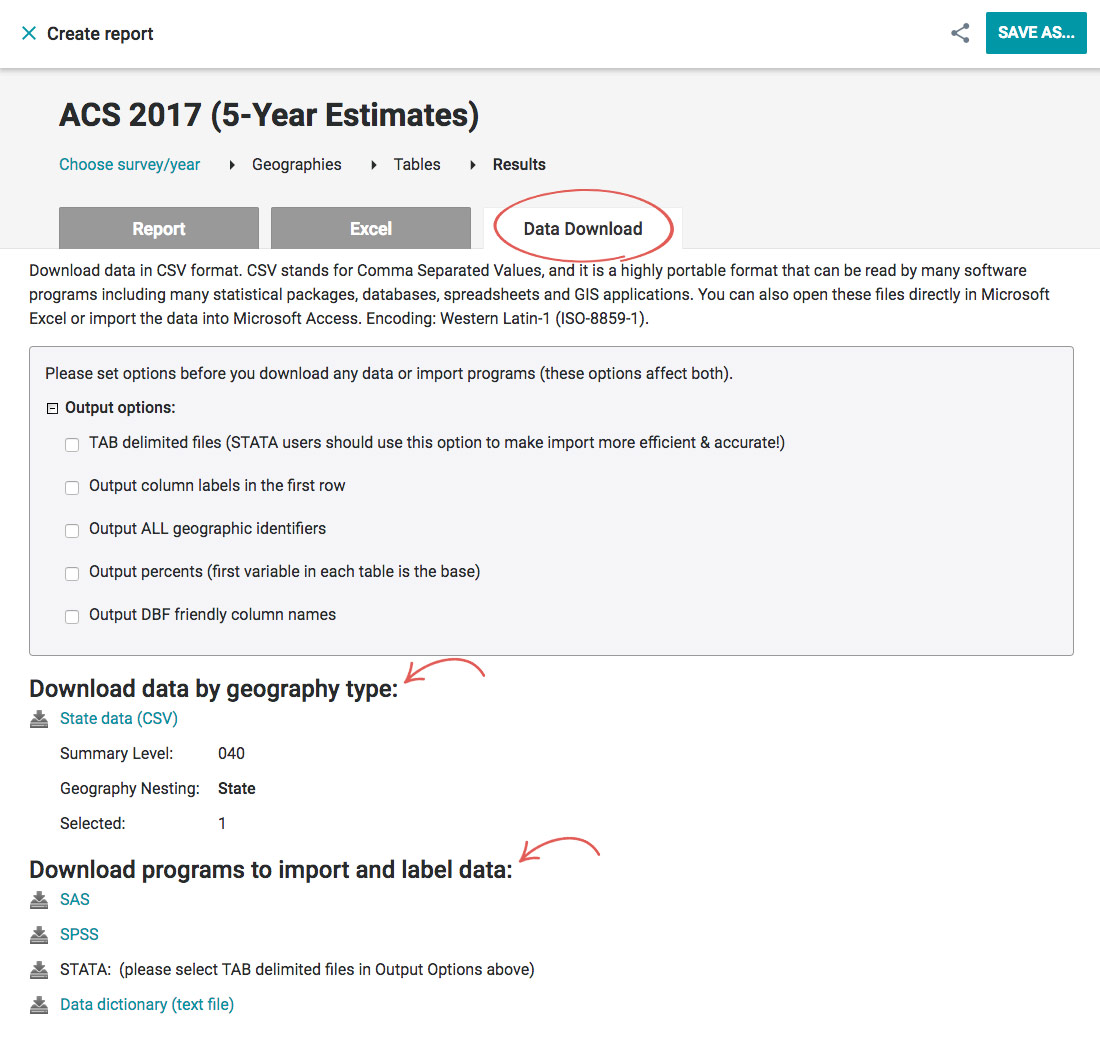
In addition to CSV files, you can also download the data to SAS and SPSS files.
Save your report as a project
If you don’t want to download your report right away, you can save it as a project, which allows you to revise or reuse it later on.
- In the upper-right corner of the Results page, click Save As…
- Enter the title and description.
- Click Save.
You can access all your saved reports by heading over to the My Reports page.
Share your report
There are a couple of ways you can share your reports.
Share a report from the Report results page
- While viewing the report you want to share, click the link icon at the top of the screen.
- Copy the link from the popup.
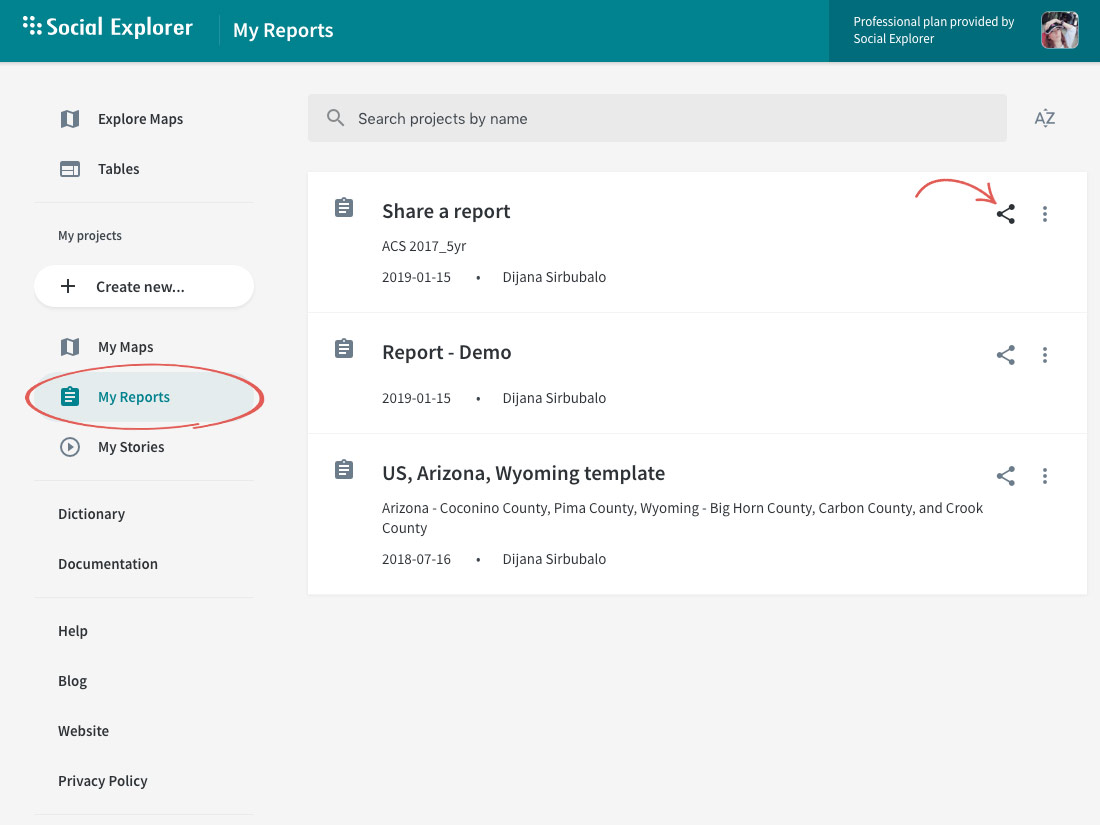
Share a report from the My Reports page
- Head over to the My Reports page.
- Click the share icon next to the report you want to share.
- Select and copy the link.