
In the world of community analysis, the distance between a critical question and a reliable answer has traditionally been measured in manual clicks, obscure table codes, and steep learning curves. For decades, extracting meaningful insights from the U.S. Census or the American Community Survey (ACS) required a specific kind of "data literacy" – the ability to navigate labyrinthine databases, memorize FIPS codes, and understand the difference between Table B19013 and B19001.
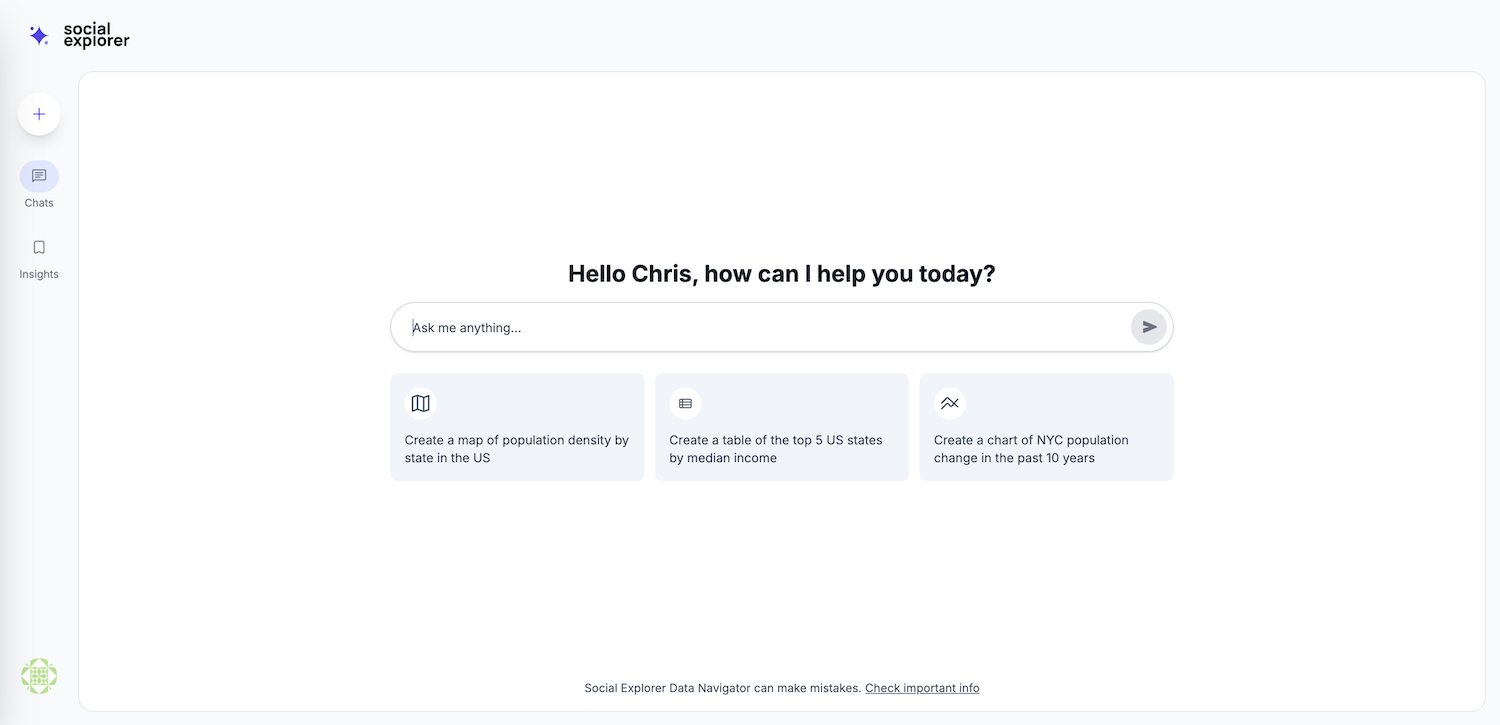
Today, that distance has been erased. We are thrilled to announce the official launch of Data Navigator, the new conversational data analysis interface for Social Explorer’s award-winning mapping software. Using AI, Data Navigator transforms complex data analysis into a simple conversation, bridging the gap between rigorous research and real-world application for everyone from undergraduate students to veteran policy analysts.
The Evolution of Data Analysis: From Menus to Conversations
Historically, Social Explorer has been the gold standard for visualizing demographic trends. However, even with the most intuitive tools, the sheer volume of available data – covering population, income, housing, health, and more – could be overwhelming. A researcher looking to compare median household income and educational attainment across the top five counties in California would traditionally spend 10 to 15 minutes clicking through menus, filtering variables, and configuring map settings.
Data Navigator changes the fundamental nature of this interaction. By leveraging a state-of-the-art Large Language Model (LLM) specifically tuned for our extensive data library, we have created a "Data-to-Insight" pipeline that functions at the speed of thought. What used to be a technical chore is now a dialogue. You go from a question to an exportable, publication-ready visualization in under a minute.
Why Data Navigator? The Four Pillars of Conversational Data Analysis
The primary goal of Data Navigator is to democratize data. By removing the technical barriers to entry, we’ve created a tool built on four core pillars:
1. Speed to Insight
In professional environments, time is the most valuable resource. Data Navigator handles most of the routine data requests that analysts receive daily. By automating the "search and fetch" phase of research, the AI allows professionals to spend less time digging for data and more time interpreting what that data means for their community or organization.
2. True Accessibility
If you can type a sentence, you can analyze any of the demographic, economic, environmental, or political datasets in our vast data library. Our natural language processing (NLP) engine is designed to be "forgiving." As early testers noted, even if a user has a typo in their query, the AI is smart enough to "glean what they really meant." It understands statistical terms, geographic nicknames, and general concepts, translating them instantly into precise database queries.
3. One Integrated Workflow
Data Navigator isn't just a search bar; it’s a comprehensive command center. Within a single chat interface, you can discover data, visualize it on a mapping interface, generate a trend chart, and export the final product. There is no need to jump between different software or browser tabs.
4. Analytical Depth
Unlike traditional search tools that simply provide an answer and stop, Data Navigator encourages curiosity. At the conclusion of every interaction, the conversational interface offers "follow-up" suggestions. These are not random prompts; they are contextually relevant suggestions designed to inspire new directions for research, such as looking at historical trends or comparing the current data against a neighboring geography.
Under the Hood: Data Navigator’s Key Features
Data Navigator is packed with features designed to handle the heavy lifting of data science. Here is what you can expect when you use Data Navigator:
- Intelligent Discovery: The AI supports keyword searches and specific table codes. It prioritizes results based on relevance, recency, and data quality, ensuring you are always working with the most reliable information.
- Instant Mapping & Visualization: Users can create single or side-by-side maps to visualize geographic disparities. The tool supports up to five variables on a single map (from the same table) and offers geographic masking to help you focus on specific regions without the distraction of surrounding data.
- Dynamic Charting: Sometimes a map isn't enough. Data Navigator can instantly generate bar (vertical and horizontal), line, area, and pie charts. Whether you are tracking a time series across decades or comparing multi-variable correlations, the visuals are generated in real-time.
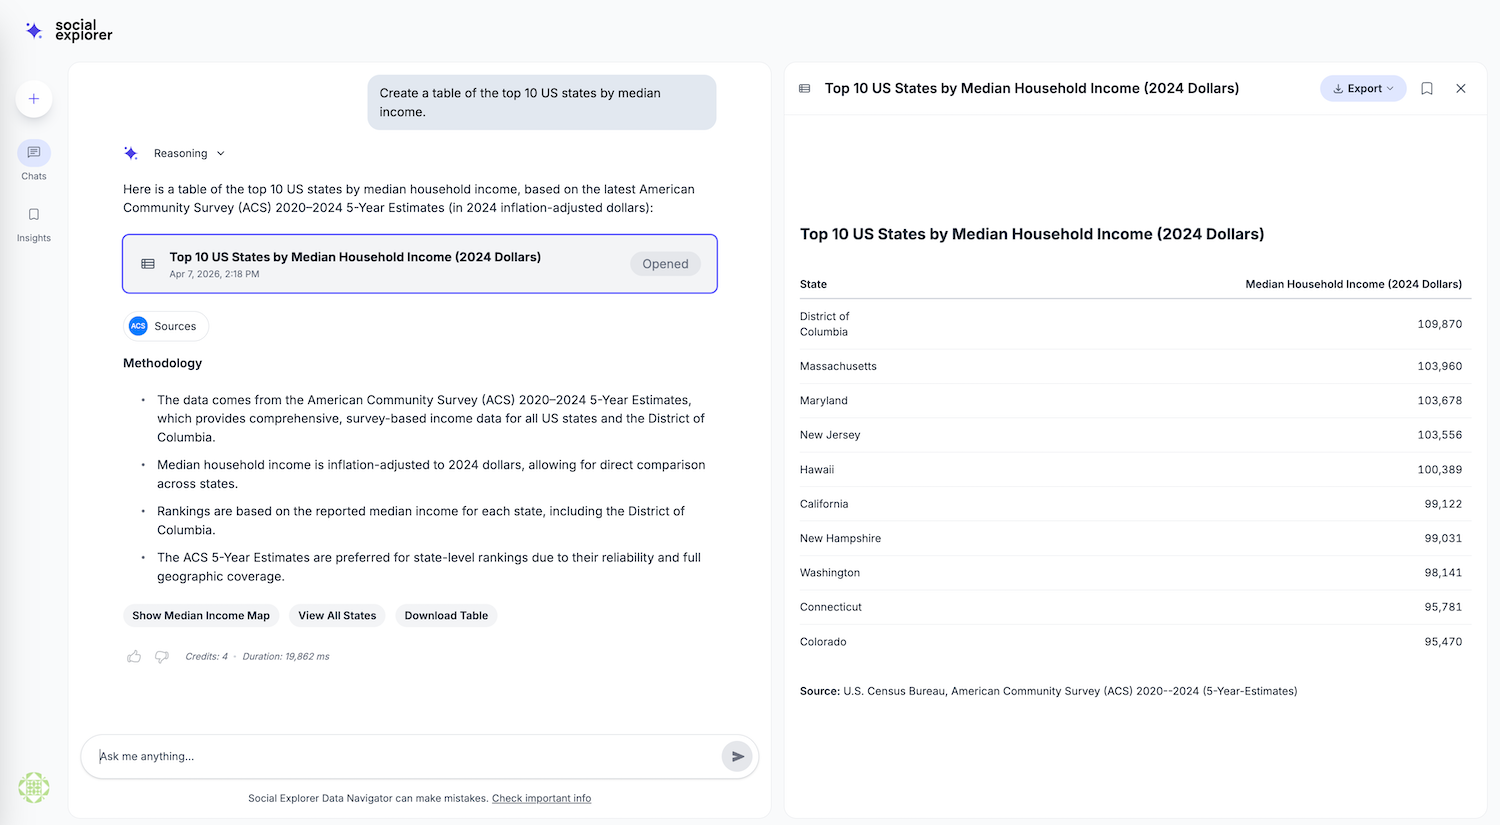
- Advanced Analytical Tools: Data Navigator will quickly identify the "top 10" or "bottom 10" performing areas for any metric across the country. And the AI includes built-in Consumer Price Index (CPI) adjustment tools, allowing you to compare 1990 income levels to 2024 dollars with a single prompt.
- The "Split View" Interface: To ensure you never lose your place, we’ve implemented a split-screen layout. Your conversation remains on the left, while your interactive map, chart, or table appears on the right.
Real-World Use Cases for Data Navigator
We designed Data Navigator to be versatile. Here is how different sectors are already leveraging the power of conversational data analysis:
Academic Researchers
Data Navigator streamlines the literature review and data collection process. It provides full methodology transparency, margin of error (MOE) displays, and the ability to export data in CSV or JSON formats. It’s a tool for high-level variable discovery that prevents "data dumping" by providing a preview workflow before you commit to a full download.
Students & Educators
In the classroom, Data Navigator serves as a powerful pedagogical tool. It removes the "technical anxiety" often associated with data science courses. Students can adopt an exploratory learning approach, asking questions like "How has the population of [my home state] changed since 1970?" and seeing the results instantly.

Government & Policy Analysts
Policy decisions require hard evidence of geographic disparities. Analysts can use the ranking tools and side-by-side maps to identify service gaps in specific neighborhoods. For example, a user can quickly identify the "bottom 10 census tracts for broadband access" in a specific state and generate a map for a policy brief in seconds.
Nonprofits & Community Organizations
Grant writing is often a race against the clock. Data Navigator simplifies grant application support by pulling neighborhood-level demographics and easy-to-cite community insights using simple language. It allows small organizations without dedicated data teams to compete for funding by providing the same level of analytical rigor as larger institutions.
Data Navigator Success Stories: Voices from the Field
We spent months testing Data Navigator with a diverse group of librarians, professors, and local government officials. Their feedback highlights the AI's accuracy and its departure from the "hallucination" problems common in other AI models. For example, Alexandra H., a Teaching Assistant at the University of Iowa, noted: "The AI was extremely clear about what it was able to do and what it wasn't ... This is very unlike ChatGPT, which tends to have an affirmation bias."
Others highlighted the sheer efficiency of the tool. Government users found that the AI correctly identified complex regional boundaries – like the Southern California Association of Governments (SCAG) – and automatically selected the relevant counties. "The AI was able to process most of my requests and create a map quicker than having to filter manually through the data myself," reported David C., a Marketing Intelligence Specialist for the Pinellas County Government.
Your Conversation with Community Data Starts Now
Data Navigator is more than just a chatbot; it is a research partner. By automating the complexities of data retrieval, visualization, and adjustment, it frees you to focus on the work that matters: identifying trends, supporting communities, and telling the story behind the numbers.
The future of community analysis isn't found in a manual – it’s found in a conversation.
Ready to start a dialogue with Data Navigator? Log in to your existing Social Explorer account or sign up for a free trial and try your first prompt. Where will the data take you?