


| Documentation: | Canadian Census 2011 |
you are here:
choose a survey
survey
document
chapter
Publisher: Statistics Canada
Survey: Canadian Census 2011
| Document: | Statistics Canada - Catalogue no. 99-000-X2011001 National Household Survey |
| citation: | Social Explorer; Statistics Canada - Catalogue no. 99-000-X2011001 National Household Survey |
Chapter Contents
Statistics Canada - Catalogue no. 99-000-X2011001 National Household Survey
For economic family members, this refers to economic family after-tax income that has been adjusted by a factor that accounts for family size. The adjustment factor takes into account the lower relative needs of additional family members, as compared to a single person living alone, and is determined by using a scale that assigns a lower value to additional family members. The adjusted after-tax family income is then computed by dividing the family's after-tax income by the factor. Multiple equivalence scales are used in published data. The one chosen for use with the NHS income data is simply the square root of family size.
For persons not in economic families, the adjusted after-tax income is set at after-tax income. This is equivalent to a factor of 1.0 for a person not in an economic family.
For persons not in economic families, the adjusted after-tax income is set at after-tax income. This is equivalent to a factor of 1.0 for a person not in an economic family.
Reported in: 2011
Reported for: Population in private households, economic families and persons not in economic families
Question no.: Derived variable
Responses: Not applicable
Remarks: For details on the components of total income, see 'Remarks' under Total income. See also After-tax income, Economic family and Economic family status.
A similar variable existed in the 2006 Census but was based on a different equivalence scale.
After-tax income of a household divided by the square root of household size.
Adjusted after-tax income of households refers to the after-tax income of a household that has been adjusted by a factor that accounts for household size. The adjustment factor takes into account the lower relative needs of additional household members, as compared to a person living alone, and is determined by using a scale that assigns a lower value to additional household members. The adjusted after-tax income of households is then computed by dividing the household's after-tax income by the factor. Multiple equivalence scales are used in published data. The one chosen for use with the NHS income data is simply the square root of household size.
Reported in: 2011
Reported for: Private households and population in private households.
Question no.: Derived variable
Responses: Not applicable
Remarks: For details on the components of total income, see 'Remarks' under Total income.
See also After-tax income, Household, private and Household size.
This variable is used to help compute the Low-income measure after-tax (LIM-AT).
For economic family members, this refers to economic family income that has been adjusted by a factor that accounts for family size. The adjustment factor takes into account the lower relative needs of additional family members, as compared to a single person living alone, and is determined by using a scale that assigns a decreasing value to the second and subsequent family members. The adjusted family income is then computed by dividing the family's income by the factor. Multiple equivalence scales are used in published data. The one chosen for use with the NHS income data is simply the square root of family size.
For persons not in economic families, the adjusted income is set at total income. This is equivalent to a factor of 1.0 for a person not in an economic family.
For persons not in economic families, the adjusted income is set at total income. This is equivalent to a factor of 1.0 for a person not in an economic family.
Reported in: 2011
Reported for: Population in private households, economic families and persons not in economic families
Question no.: Derived variable
Responses: Not applicable
Remarks: For details on the components of total income, see 'Remarks' under Total income. For details on the economic family and economic family status of individuals, see Economic family and Economic family status.
A similar variable existed in the 2006 Census but was based on a different equivalence scale.
Sum of the market income of household members divided by the square root of household size.
Adjusted market income of households refers to the sum of market income of all members of the household that has been adjusted by a factor that accounts for household size. The adjustment factor takes into account the lower relative needs of additional household members, as compared to a person living alone, and is determined by using a scale that assigns a lower value to additional household members. The adjusted market income of households is thus computed by dividing the sum of market income of household members by the factor. Multiple equivalence scales are used in published data. The one chosen for use with the NHS income data is simply the square root of household size.
Reported in: 2011
Reported for: Private households and population in private households
Question no.: Derived variable
Responses: Not applicable
Remarks: For details on the components of market income, see Market income.
See also Household, private and Household size.
This variable is used to help compute the Low-income measure of market income (LIM-MI).
Adjusted total income of households refers to the household total income that has been adjusted by a factor that accounts for household size. The adjustment factor takes into account the lower relative needs of additional household members, as compared to a person living alone, and is determined by using a scale that assigns a lower value to additional household members. The adjusted total income of households is thus computed by dividing the household total income by the factor. Multiple equivalence scales are used in published data. The one chosen for use with the NHS income data is simply the square root of household size.
Reported in: 2011
Reported for: Private households and population in private households
Question no.: Derived variable
Responses: Not applicable
Remarks: For details on the components of total income, see 'Remarks' under Total income.
See also Household, private and Household size.
This variable is used to help compute the Low-income measure before-tax (LIM-BT).
Refers to total income from all sources minus federal, provincial and territorial income taxes paid for 2010.
Refers to total income minus federal, provincial and territorial income taxes paid for calendar year 2010. Total income refers to income from all sources, including employment income, income from government programs, pension income, investment income and any other money income. Federal, provincial and territorial taxes paid refer to taxes on income, after taking into account exemptions, deductions, non-refundable tax credits and the Quebec abatement. These taxes are obtained from the income tax files for persons who allowed access to their income tax data and from direct responses on the questionnaire for others.
The after-tax income of a census family is the sum of the after-tax incomes of all members of that family.
Reported in: 2011
Reported for: Census families in private households
Question no.: Derived variable: Questions 54 and 55
Responses: Positive or negative dollar value or nil
Remarks: For details on the components of total income and on the reference period, coverage and methodology for income data, see 'Remarks' under Total income. See also After-tax income and Census family.
The after-tax income of an economic family is the sum of the after-tax incomes of all members of that family.
Reported in: 2011
Reported for: Economic families in private households
Question no.: Derived variable: Questions 54 and 55
Responses: Positive or negative dollar value or nil
Remarks: For details on the components of total income and on the reference period, coverage and methodology for income data, see 'Remarks' under Total income. See also After-tax income and Economic family.
The after-tax income of a household is the sum of the after-tax incomes of all members of that household.
Reported in: 2011
Reported for: Private households
Question no.: Derived variable: Questions 54 and 55
Responses: Positive or negative dollar value or nil
Remarks: For details on the components of total income and on the reference period, coverage and methodology for income data, see 'Remarks' under Total income. See also After-tax income and Household, private.
Average income of families (census or economic) or persons aged 15 years and over not in families refers to the sum of total incomes of these families or persons in 2010 divided by the number of units.
Average income of households refers to the sum of total incomes in 2010 of households divided by the total number of households.
Average income of individuals refers to the dollar amount obtained by adding up the total income of all individuals aged 15 years and over who reported income for 2010 and dividing this sum by the number of individuals with income.
Refers to benefits received during calendar year 2010 from the Canada Pension Plan or Quebec Pension Plan (for example, retirement pensions, survivors' benefits and disability pensions). Does not include lump-sum death benefits.
Refers to total Employment Insurance benefits received during calendar year 2010, before income tax deductions. It includes benefits for unemployment, sickness, maternity, parental, adoption, compassionate care and benefits to self-employed fishers received under the federal Employment Insurance program or the Québec Parental Insurance Plan.
Reported in: 2011
Reported for: Population aged 15 years and over in private households
Question no.: Direct variable: Questions 54 and 55(g)
Responses: Dollar value or nil
Remarks: See also 'Remarks' under Total income.
The amount to be repaid based on net income when filing a tax return is excluded.
Reported for: Population aged 15 years and over in private households
Question no.: Direct variable: Questions 54 and 55(g)
Responses: Dollar value or nil
Remarks: See also 'Remarks' under Total income.
The amount to be repaid based on net income when filing a tax return is excluded.
Census family total income is the sum of the total incomes of all members of that family.
Reported in: 2011
Reported for: Census families in private households
Question no.: Derived variable: Questions 54 and 55
Responses: Positive or negative dollar value or nil
Remarks: For details on the components of total income, see 'Remarks' under Total income.
See also Census family.
Reported for: Census families in private households
Question no.: Derived variable: Questions 54 and 55
Responses: Positive or negative dollar value or nil
Remarks: For details on the components of total income, see 'Remarks' under Total income.
See also Census family.
Refers to payments received under the Canada Child Tax Benefit program during calendar year 2010 by parents with dependent children under 18 years of age. Included with the Canada Child Tax Benefit is the National Child Benefit Supplement (NCBS) for low-income families with children. The NCBS is the federal contribution to the National Child Benefit (NCB), a joint initiative of federal, provincial and territorial governments. Also included in this variable are child benefits, child disability benefits and earned income supplements provided by certain provinces and territories and the Universal Child Care Benefit (UCCB).
Payments made in 2010 for child care arrangements which allowed the responsible person(s) to earn
employment income.
Refers to all payments made over the period of 2010 for non-parental child care arrangements which allowed the responsible person(s) to earn employment income. Included in these expenses are babysitters, daycares, day camps, live-in caregivers or any arrangement in which money was exchanged for child care services. Excluded are child care payments made for purposes unrelated to earning employment income, such as entertainment or personal needs.
Reported in: 2011
Reported for: Population aged 15 years and over in private households
Question no.: Direct variable: Question 52
Responses: Dollar value or nil
Remarks: Introduced in the 2011 NHS, child care expenses paid were collected to help compute the deductions required from after-tax income to obtain Disposable income for the MBM.
These amounts differ slightly from the related income tax deduction: the value is not capped based on the age of the children, any family member could report them.
Payments made in 2010 to a former spouse or partner for child and/or spousal support.
Child or spousal support payments paid in 2010 under an agreement to pay a fixed amount on a regular basis to a former spouse or partner, or for a child. This variable excludes all other gifts or transfers of money.
Reported in: 2011
Reported for: Population aged 15 years and over in private households
Question no.: Direct variable: Question 53
Responses: Dollar value or nil
Remarks: Introduced in the 2011 NHS, child or spousal support payments were taken into account to help compute the deductions required from after-tax income to obtain Disposable income for the MBM.
Support payments received from a former spouse or partner would be considered income and included in Other money income.
The composition of the total income of a population group or a geographic area refers to the relative share of each income source or group of sources, expressed as a percentage of the aggregate total income of that group or area.
Reported in: 2011
Reported for: Population aged 15 years and over with income in private households
Question no.: Derived statistic
Responses: Not applicable
Remarks: The components of total income and the combinations for which percentages may be published are shown in Figure 3.1 Components of income in 2010.
Figure 3.1 Components of income in 2010
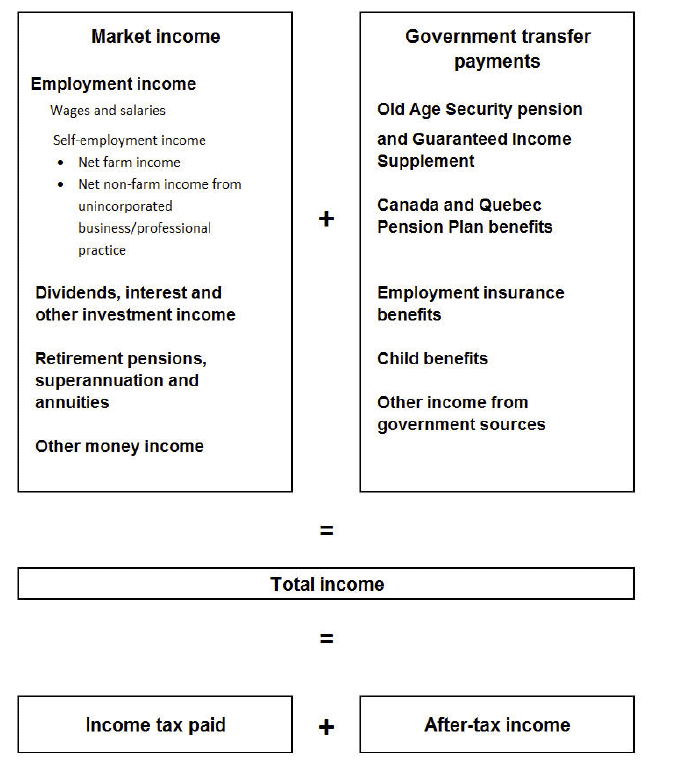
Source: Statistics Canada, Income Statistics Division.
Reported for: Population aged 15 years and over with income in private households
Question no.: Derived statistic
Responses: Not applicable
Remarks: The components of total income and the combinations for which percentages may be published are shown in Figure 3.1 Components of income in 2010.
Figure 3.1 Components of income in 2010
Source: Statistics Canada, Income Statistics Division.
Refers to the disposable income available to an economic family or a person not in an economic family as defined for the Human Resources and Skills Development Canada's (HRSDC) Market Basket Measure (MBM).
The disposable income for the MBM is an income concept developed by Human Resources and Skills Development Canada (HRSDC) for comparing against the Market Basket Measure (MBM) thresholds.
The disposable income for the MBM is the amount of income available to purchase goods and services. It is derived by deducting income taxes and non-discretionary spending for the MBM from total income.
For units in households that own a dwelling without a mortgage, the mortgage-free homeowner's advantage for the MBM is added to the disposable family income. This amount represents typical savings compared to rent or ownership with a mortgage.
Reported in: 2011
Reported for: Economic families and persons not in economic families aged 15 years and over in private households
Question no.: Derived variable
Responses: Not applicable
Remarks: Like the MBM thresholds, the mortgage-free homeowner's advantage for the MBM is defined for each of the 49 MBM geographies. These amounts are presented in Table 3.6 Mortgage-free homeowner's advantage for the Market Basket Measure (MBM), 2010.
For the LICO-AT and the LIM-AT, only income taxes paid are deducted from total family income before comparison to the associated low-income thresholds.
See also Non-discretionary spending for the MBM and Market Basket Measure (MBM).
For information on various low-income concepts and disposable income, see also Low income lines, 2011-2012, Income Research Paper Series (Catalogue no. 75F0002M - no. 002).
Table 3.6 Mortgage-free homeowner's advantage for the Market Basket Measure (MBM), 2010
Note: The geographic area concepts and the Market Basket Measure (MBM) thresholds were defined by Human Resources and Skills Development Canada (HRSDC). This amount corresponds to the cost of a specific basket of goods and services representing a modest, basic standard of living in each of the 49 MBM geographic regions.
1 To convert to other family sizes, multiply the amount for persons not in economic families by the square root of the desired family size.
Source: Statistics Canada, Income Statistics Division.
Reported for: Economic families and persons not in economic families aged 15 years and over in private households
Question no.: Derived variable
Responses: Not applicable
Remarks: Like the MBM thresholds, the mortgage-free homeowner's advantage for the MBM is defined for each of the 49 MBM geographies. These amounts are presented in Table 3.6 Mortgage-free homeowner's advantage for the Market Basket Measure (MBM), 2010.
For the LICO-AT and the LIM-AT, only income taxes paid are deducted from total family income before comparison to the associated low-income thresholds.
See also Non-discretionary spending for the MBM and Market Basket Measure (MBM).
For information on various low-income concepts and disposable income, see also Low income lines, 2011-2012, Income Research Paper Series (Catalogue no. 75F0002M - no. 002).
Table 3.6 Mortgage-free homeowner's advantage for the Market Basket Measure (MBM), 2010
| MBM region | Persons not in economic families | Economic family size1 | |||
| 2 persons | 3 persons | 4 persons | 5 persons | ||
| Newfoundland and Labrador | |||||
| Rural areas | 1,460 | 2,065 | 2,529 | 2,920 | 3,265 |
| Small population centres with less than 30,000 persons | 1,319 | 1,865 | 2,284 | 2,637 | 2,948 |
| St. John's (CMA) | 1,424 | 2,013 | 2,466 | 2,847 | 3,183 |
| Prince Edward Island | |||||
| Rural areas | 1,665 | 2,355 | 2,884 | 3,330 | 3,723 |
| Small population centres with less than 30,000 persons | 1,565 | 2,213 | 2,711 | 3,130 | 3,499 |
| Charlottetown (CA) | 1,807 | 2,555 | 3,129 | 3,613 | 4,039 |
| Nova Scotia | |||||
| Rural areas | 1,890 | 2,673 | 3,274 | 3,780 | 4,226 |
| Small population centres with less than 30,000 persons | 1,409 | 1,993 | 2,440 | 2,818 | 3,151 |
| Medium population centres with a population between 30,000 and 99,999 persons | 1,881 | 2,660 | 3,258 | 3,762 | 4,206 |
| Halifax (CMA) | 2,164 | 3,060 | 3,747 | 4,327 | 4,838 |
| Cape Breton (CA) | 1,441 | 2,038 | 2,496 | 2,882 | 3,222 |
| New Brunswick | |||||
| Rural areas | 1,570 | 2,220 | 2,719 | 3,140 | 3,511 |
| Small population centres with less than 30,000 persons | 1,406 | 1,988 | 2,435 | 2,812 | 3,144 |
| Medium population centres with a population between 30,000 and 99,999 persons | 1,316 | 1,860 | 2,279 | 2,631 | 2,942 |
| Fredericton (CA) | 2,495 | 3,528 | 4,321 | 4,989 | 5,578 |
| Saint John (CMA) | 1,391 | 1,966 | 2,408 | 2,781 | 3,109 |
| Moncton (CMA) | 1,895 | 2,679 | 3,281 | 3,789 | 4,236 |
| Quebec | |||||
| Rural areas | 1,223 | 1,730 | 2,118 | 2,446 | 2,735 |
| Small population centres with less than 30,000 persons | 945 | 1,336 | 1,636 | 1,889 | 2,112 |
| Medium population centres with a population between 30,000 and 99,999 persons | 1,197 | 1,692 | 2,072 | 2,393 | 2,675 |
| Large urban population centres with a population between 100,000 and 499,999 persons | 1,239 | 1,752 | 2,145 | 2,477 | 2,769 |
| Québec (CMA) | 1,443 | 2,041 | 2,499 | 2,886 | 3,227 |
| Montréal (CMA) | 1,376 | 1,945 | 2,382 | 2,751 | 3,076 |
| Ontario | |||||
| Rural areas | 1,917 | 2,710 | 3,319 | 3,833 | 4,285 |
| Small population centres with less than 30,000 persons | 1,617 | 2,287 | 2,801 | 3,234 | 3,616 |
| Medium population centres with a population between 30,000 and 99,999 persons | 1,750 | 2,475 | 3,031 | 3,500 | 3,913 |
| Large urban population centres with a population between 100,000 and 499,999 persons | 2,047 | 2,895 | 3,546 | 4,094 | 4,577 |
| Ottawa - Gatineau (Ontario part) (CMA) | 2,715 | 3,839 | 4,702 | 5,429 | 6,070 |
| Hamilton (CMA) | 1,930 | 2,729 | 3,342 | 3,859 | 4,314 |
| Toronto (CMA) | 2,871 | 4,060 | 4,973 | 5,742 | 6,420 |
| Manitoba | |||||
| Rural areas | 1,400 | 1,980 | 2,425 | 2,800 | 3,130 |
| Small population centres with less than 30,000 persons | 1,695 | 2,397 | 2,936 | 3,390 | 3,790 |
| Brandon (CA) | 1,851 | 2,618 | 3,206 | 3,702 | 4,139 |
| Winnipeg (CMA) | 1,959 | 2,770 | 3,393 | 3,918 | 4,380 |
| Saskatchewan | |||||
| Rural areas | 1,143 | 1,616 | 1,979 | 2,285 | 2,555 |
| Small population centres with less than 30,000 persons | 1,185 | 1,675 | 2,052 | 2,369 | 2,649 |
| Medium population centres with a population between 30,000 and 99,999 persons | 1,245 | 1,761 | 2,156 | 2,490 | 2,784 |
| Saskatoon (CMA) | 1,409 | 1,993 | 2,440 | 2,818 | 3,151 |
| Regina (CMA) | 1,413 | 1,998 | 2,447 | 2,826 | 3,160 |
| Alberta | |||||
| Rural areas | 2,149 | 3,038 | 3,721 | 4,297 | 4,804 |
| Small population centres with less than 30,000 persons | 2,373 | 3,356 | 4,110 | 4,746 | 5,306 |
| Medium population centres with a population between 30,000 and 99,999 persons | 2,881 | 4,074 | 4,989 | 5,761 | 6,441 |
| Edmonton (CMA) | 2,473 | 3,497 | 4,282 | 4,945 | 5,529 |
| Calgary (CMA) | 2,948 | 4,168 | 5,105 | 5,895 | 6,591 |
| British Columbia | |||||
| Rural areas | 2,818 | 3,985 | 4,880 | 5,635 | 6,300 |
| Small population centres with less than 30,000 persons | 2,487 | 3,516 | 4,307 | 4,973 | 5,560 |
| Medium population centres with a population between 30,000 and 99,999 persons | 2,784 | 3,936 | 4,821 | 5,567 | 6,224 |
| Large urban population centres with a population between 100,000 and 499,999 persons | 3,449 | 4,877 | 5,973 | 6,897 | 7,711 |
| Vancouver (CMA) | 3,520 | 4,978 | 6,097 | 7,040 | 7,871 |
Note: The geographic area concepts and the Market Basket Measure (MBM) thresholds were defined by Human Resources and Skills Development Canada (HRSDC). This amount corresponds to the cost of a specific basket of goods and services representing a modest, basic standard of living in each of the 49 MBM geographic regions.
1 To convert to other family sizes, multiply the amount for persons not in economic families by the square root of the desired family size.
Source: Statistics Canada, Income Statistics Division.
Refers to all dividends, interest and other investment income, excluding capital gains or losses, received in
2010.
Refers to interest received during calendar year 2010 from deposits in banks, trust companies, cooperatives,
credit unions, caisses populaires, etc., as well as interest on savings certificates, bonds and debentures, and all dividends from both Canadian and foreign corporate stocks and mutual funds. Also included is other investment income from either Canadian or foreign sources, such as net rents from real estate, mortgage and loan interest received, regular income from an estate or trust fund, and interest from insurance policies. Does not include capital gains or losses.
Reported in: 2011
Reported for: Population aged 15 years and over in private households
Question no.: Direct variable: Questions 54 and 55(i)
Responses: Positive or negative dollar value or nil
Remarks: While it should be included conceptually, it was not always possible to measure the income earned within a registered Tax-free Savings Account (TFSA). Refer to the Income Reference Guide, National Household Survey, for more details.
See also 'Remarks' under Total income.
Refers to a person aged 15 years and over, who received wages and salaries, net income from a non-farm
unincorporated business and/or professional practice, and/or net farm self-employment income during calendar year 2010.
Refers to total income received by persons aged 15 years and over during calendar year 2010 as wages and
salaries, net income from a non-farm unincorporated business and/or professional practice, and/or net farm
self-employment income.
Reported in: 2011
Reported for: Population aged 15 years and over in private households
Question no.: Derived variable: Questions 54 and 55(a), (b) and (c)
Responses: Positive or negative dollar value or nil
Remarks: See 'Remarks' under Total income.
See also the detailed definitions for each of the components.
Reported for: Population aged 15 years and over in private households
Question no.: Derived variable: Questions 54 and 55(a), (b) and (c)
Responses: Positive or negative dollar value or nil
Remarks: See 'Remarks' under Total income.
See also the detailed definitions for each of the components.
The economic family total income is the sum of the total incomes of all members of that family.
Reported in: 2011
Reported for: Economic families in private households
Question no.: Derived variable: Questions 54 and 55
Responses: Positive or negative dollar value or nil
Remarks: For details on the components of total income, see 'Remarks' under Total income.
See also Economic family.
Reported for: Economic families in private households
Question no.: Derived variable: Questions 54 and 55
Responses: Positive or negative dollar value or nil
Remarks: For details on the components of total income, see 'Remarks' under Total income.
See also Economic family.
Refers to all cash benefits received from federal, provincial, territorial or municipal governments during 2010.
Refers to total income from all transfer payments received from federal, provincial, territorial or municipal
governments during calendar year 2010. This variable is derived by summing the amounts reported in:
- he Old Age Security pension and Guaranteed Income Supplement, Allowance and Allowance for the Survivor
- benefits from Canada Pension Plan or Quebec Pension Plan
- benefits from employment Insurance
- child benefits
- other income from government sources.
Reported in: 2011
Reported for: Population aged 15 years and over in private households
Question no.: Derived variable based upon responses to Questions 54 and 55(d), (e), (f), (g) and (h)
Responses: Dollar value or nil
Remarks: See the detailed definitions and 'Remarks' for each of the components.
Reported for: Population aged 15 years and over in private households
Question no.: Derived variable based upon responses to Questions 54 and 55(d), (e), (f), (g) and (h)
Responses: Dollar value or nil
Remarks: See the detailed definitions and 'Remarks' for each of the components.
The total income of a household is the sum of the total incomes of all members of that household.
The population in private households is sorted according to its adjusted after-tax family income and then divided into 10 equal groups each containing 10% of the population.
The income decile group provides a rough ranking of the economic situation of a person based on his or her
relative position in the economic families adjusted after-tax income distribution. The population in private
households is sorted according to its adjusted after-tax family income and then divided into 10 equal groups
each containing 10% of the population.
Reported in: 2011
Reported for: Population in private households
Question no.: Variable dérivée
Responses: In the lowest decile
In the second decile
In the third decile
In the fourth decile
In the fifth decile
In the sixth decile
In the seventh decile
In the eighth decile
In the ninth decile
In the highest decile
Remarks: Refer to Adjusted after-tax income for economic families and persons not in economic families.
Refers to the position of a person, economic family, person not in an economic family aged 15 years or over, or household in relation to one of the low income lines.
The income status can be defined in several ways.
Refers to the position of a person, economic family, person not in an economic family aged 15 years or over, or household in relation to one of the low income lines.
In the National Household Survey, definitions were created for six different lines. Five lines were defined by Statistics Canada:
Refers to the position of a person, economic family, person not in an economic family aged 15 years or over, or household in relation to one of the low income lines.
In the National Household Survey, definitions were created for six different lines. Five lines were defined by Statistics Canada:
- low-income measure based on after-tax income (LIM-AT)
- low-income measure based on before-tax income (LIM-BT)
- low-income measure based on market income (LIM-MI)
- low-income cut-off based on after-tax income (LICO-AT)
- low-income cut-off based on before-tax income (LICO-BT).
- HRSDC's Market Basket Measure (MBM).
Reported in: 2011
Reported for: Population in private households and, depending on the definition used, economic families and persons not in economic families aged 15 years and over in private households or, private households.
Question no.: Derived variable
Responses: Below the line - In low income;
At or above the line - Other;
Not applicable.
Remarks: Four dimensions generally distinguish the low-income lines:
Full details are explained in each definition:
Members of an economic family all share the same income status for LICO-AT and LICO-BT.
The low income concept does not apply to the full population in private households. For the purposes of low income statistics, units in the Yukon Territory, Northwest Territories and Nunavut and on Indian reserves were excluded (see Area of residence - On reserve for the full criteria).
The low income after-tax cut-offs were based on certain expenditure–income patterns which are not available from survey data for the entire population.
It is also felt that in certain areas, the consumption of hunting or fishing products, barter economies or substantial in-kind transfers may reduce the interpretability of income-based measures.
See also Prevalence of low income, Low-income gap and Severity of low income.
Refer to the data quality notes in the Income Reference Guide, National Household Survey, 2011.
Tables 3.1 Summary of low-income lines in the 2011 National Household Survey
Source: Statistics Canada, Income Statistics Division.
Reported for: Population in private households and, depending on the definition used, economic families and persons not in economic families aged 15 years and over in private households or, private households.
Question no.: Derived variable
Responses: Below the line - In low income;
At or above the line - Other;
Not applicable.
Remarks: Four dimensions generally distinguish the low-income lines:
- any geographical variations
- aggregation or unit of analysis
- the income variable to test
- equivalence scale for units of different sizes
Full details are explained in each definition:
- Low-income measure after-tax (LIM-AT)
- Low-income measure before-tax (LIM-BT)
- Low-income measure of market income (LIM-MI)
- Low-income after-tax cut-off (LICO-AT)
- Low-income before-tax cut-off (LICO-BT)
- HRSDC's Market Basket Measure (MBM).
Members of an economic family all share the same income status for LICO-AT and LICO-BT.
The low income concept does not apply to the full population in private households. For the purposes of low income statistics, units in the Yukon Territory, Northwest Territories and Nunavut and on Indian reserves were excluded (see Area of residence - On reserve for the full criteria).
The low income after-tax cut-offs were based on certain expenditure–income patterns which are not available from survey data for the entire population.
It is also felt that in certain areas, the consumption of hunting or fishing products, barter economies or substantial in-kind transfers may reduce the interpretability of income-based measures.
See also Prevalence of low income, Low-income gap and Severity of low income.
Refer to the data quality notes in the Income Reference Guide, National Household Survey, 2011.
Tables 3.1 Summary of low-income lines in the 2011 National Household Survey
| Dimensions | Low-income concept | ||
| Low Income Measures (LIM) | Low-income cut-offs (LICO) | Market Basket Measure (MBM) | |
| Geography | One level across Canada | Size of area of residence | 49 regions |
| Unit for income | Households | Economic families and persons 15+ not in EF | Economic families and persons 15+ not in EF |
| Adjustment factor | Square root of household size | Different lines based on size of economic family up to 7+ members category | Square root of economic family size |
| Income | After-tax income of households1 | After-tax income of economic families4 | Disposable income for MBM for economic families and persons not in economic families6 |
| Household total income2 | |||
| Market income of households3 | Economic family total income5 | ||
| Line | Half the median of adjusted income | Income level at which families usually spend 20 percentage points more than the average family on shelter, food and clothing7 | Price of the basket of goods and services for the reference family8 |
| Notes: | |||
| 1For the Low-income measure after-tax (LIM-AT). | |||
| 2For the Low-income measure before-tax (LIM-BT). | |||
| 3For the Low-income measure of market income (LIM-MI). | |||
| 4For the Low-income after-tax cut-offs (LICO-AT). | |||
| 5For the Low-income before-tax cut-offs (LICO-BT). | |||
| 6For HRSDC's Market Basket Measure (MBM). | |||
| 7Based on estimates from the 1992 Family Expenditure Survey adjusted to 2010 dollars with the Consumer Price Index (CPI). | |||
| 8The contents of the basket were defined by Human Ressources and Skills Development Canada, prices were measured by Statistics Canada. | |||
Refers to all federal, provincial and territorial taxes paid on 2010 income.
Refers to all federal, provincial and territorial taxes paid on 2010 income. Federal, provincial and territorial taxes paid refer to taxes on income, after taking into account exemptions, deductions, non-refundable tax credits and the Quebec abatement. These taxes are obtained from the income tax files for persons who allowed access to their income tax data and from direct responses on the questionnaire for others.
Reported in: 2011
Reported for: Population aged 15 years and over in private households
Question no.: Direct variable: Questions 54 and 55
Responses: Dollar value or nil
Remarks: Income tax paid on 2010 income includes amounts that may not be paid until 2011 or later. Taxes paid in 2010 on income from 2009 or earlier are excluded.
Contributions to Employment Insurance and to Canada Pension Plan (or Quebec Pension Plan), both federal programs, are not included in income taxes, nor are they deducted from income to arrive at after-tax income.
Some of the income tax included may be liable for taxable amounts not considered income in our standard statistical definitions such as capital gains or Registered Retirement Savings Plan (RRSP) withdrawals.
The low-income gap measures how many dollars are required to bring a low-income unit up to the low-income line.
The low-income gap measures by how many dollars an income falls below a low-income line. The variable is zero for income at or above the line. The maximum value for this field is the applicable low-income line.
The low-income gap ratio is an alternate measure that expresses the low-income gap as a fraction of the low-income line. This statistic is zero if the income is at or above the line and is one if the income is zero or negative.
The low-income gap ratio is an alternate measure that expresses the low-income gap as a fraction of the low-income line. This statistic is zero if the income is at or above the line and is one if the income is zero or negative.
Reported in: 2011
Reported for: Population in private households and, depending on the definition used, economic families and persons not in economic families aged 15 years and over in private households or, private households.
Question no.: Not applicable
Responses: Not applicable
Remarks: The gap and gap ratio are calculated for each of the six low-income lines available on the NHS. These variables are appropriate for distributions and some statistics.
See also Income status and related low-income line definitions.
Income levels at which families or persons not in economic families spend 20 percentage points more than average of their after-tax income on food, shelter and clothing.
Measures of low income known as low income cut-offs (LICOs) were first introduced in Canada in 1968 based on 1961 Census income data and 1959 family expenditure patterns. At that time, expenditure patterns indicated that Canadian families spent about 50% of their total income on food, shelter and clothing. It was arbitrarily estimated that families spending 70% or more of their income (20 percentage points more than the average) on these basic necessities would be in 'straitened' circumstances. With this assumption, low income cut-off points were set for six different sizes of families and persons aged 15 years and over, not in economic families.
Subsequent to these initial cut-offs, revised low income cut-offs were established based on national family expenditure data from 1969, 1978, 1986 and 1992. Cut-offs for other years are indexed by applying the corresponding Consumer Price Index (CPI) inflation rate to the cut-offs from the base year. For the NHS, the 1992 base year was used to construct the cut-offs.
The initial LICOs were based upon the total income before tax of families and persons aged 15 years and over, not in economic families.
After a comprehensive review of low income cut-offs completed in 1991, low income cut-offs based upon after-tax income were published for the first time in Income After Tax, Distributions by Size in Canada, 1990 (Catalogue no. 13-210).
In a similar fashion to the derivation of low income cut-offs based upon total income before tax, cut-offs are estimated independently for economic families and persons not in economic families based upon family expenditure and income after tax. Consequently the low income after-tax cut-offs are set at after-tax income levels, differentiated by size of family and area of residence, where families spend 20 percentage points more of their after-tax income than the average family on food, shelter and clothing. Based on the 1992 Family Expenditure Survey, families spent 43%, on average, of their after-tax income on necessities. The threshold was thus set to the income level where families spent 63% of their after-tax income on necessities.
The following is the 2010 matrix of low income after-tax cut-offs:
Table 3.3 Low income after-tax cut-offs (LICO-AT at 1992 base) for economic families and persons not in economic families, 2010
Reported in: 2011
Reported for: Economic families and persons aged 15 years and over not in economic families in private households
Question no.: Not applicable
Responses: Not applicable
Remarks: Low-income cut-off is one of a series of low-income lines used in the National Household Survey. See also Income status; Prevalence of low income; Low-income gap; Severity of low income and After-tax income of economic families.
The choice of using before- or after-tax income cut-offs depends upon the analysis undertaken. The after-tax income cut-offs will take into account the reduced spending power of families because of income taxes paid.
Since their initial publication, Statistics Canada has clearly and consistently emphasized that the LICOs are not measures of poverty. Rather, LICOs reflect a consistent and well-defined methodology that identifies those who are substantially worse off than average. These measures have enabled Statistics Canada to report important trends, such as the changing composition of those below the LICOs over time.
Table 3.3 Low income after-tax cut-offs (1992 base) for economic families and persons not in economic families, 2010
Source: Income Research Paper Series, Low-Income Lines 2010-2011, Statistics Canada Catalogue no. 75F0002MIE, 2012 no. 002.
Reported for: Economic families and persons aged 15 years and over not in economic families in private households
Question no.: Not applicable
Responses: Not applicable
Remarks: Low-income cut-off is one of a series of low-income lines used in the National Household Survey. See also Income status; Prevalence of low income; Low-income gap; Severity of low income and After-tax income of economic families.
The choice of using before- or after-tax income cut-offs depends upon the analysis undertaken. The after-tax income cut-offs will take into account the reduced spending power of families because of income taxes paid.
Since their initial publication, Statistics Canada has clearly and consistently emphasized that the LICOs are not measures of poverty. Rather, LICOs reflect a consistent and well-defined methodology that identifies those who are substantially worse off than average. These measures have enabled Statistics Canada to report important trends, such as the changing composition of those below the LICOs over time.
Table 3.3 Low income after-tax cut-offs (1992 base) for economic families and persons not in economic families, 2010
Size of area of residence | |||||
| Economic family size | Rural area | Small population centres with less than 30,000 persons | Medium population centres with a population between 30,000 and 99,999 persons | Large urban population centres | |
| Population between 100,000 and 499,999 | Population 500,000 persons or more | ||||
| Person not in an economic family | 12,271 | 14,044 | 15,666 | 15,865 | 18,759 |
| 2 persons | 14,936 | 17,094 | 19,069 | 19,308 | 22,831 |
| 3 persons | 18,598 | 21,283 | 23,744 | 24,043 | 28,430 |
| 4 persons | 23,202 | 26,554 | 29,623 | 29,996 | 35,469 |
| 5 persons | 26,421 | 30,237 | 33,732 | 34,157 | 40,388 |
| 6 persons | 29,301 | 33,534 | 37,410 | 37,881 | 44,791 |
| 7 or more persons | 32,182 | 36,831 | 41,087 | 41,604 | 49,195 |
Source: Income Research Paper Series, Low-Income Lines 2010-2011, Statistics Canada Catalogue no. 75F0002MIE, 2012 no. 002.
Income levels at which families or persons not in economic families spend 20 percentage points more than average of their before tax income on food, shelter and clothing.
Measures of low income known as low income (before tax) cut-offs (LICO-BT) were first introduced in Canada in 1968 based on 1961 Census income data and 1959 family expenditure patterns. At that time, expenditure patterns indicated that Canadian families spent about 50% of their total income on food, shelter and clothing. It was arbitrarily estimated that families spending 70% or more of their income (20 percentage points more than the average) on these basic necessities would be in 'straitened' circumstances. With this assumption, low income cut-off points were set for six different sizes of families and persons aged 15 years and over not in economic families.
Subsequent to these initial cut-offs, revised low income before tax cut-offs were established based on national family expenditure data from 1969, 1978, 1986 and 1992. Cut-offs for other years are indexed by applying the corresponding Consumer Price Index (CPI) inflation rate to the cut-offs from the base year. For the NHS, the 1992 base year was used to construct the cut-offs.
The initial LICOs were based upon the total income before tax of families and persons aged 15 years and over, not in economic families.
After a comprehensive review of low income cut-offs completed in 1991, low income cut-offs based upon after-tax income were published for the first time in Income After Tax, Distributions by Size in Canada, 1990 (Catalogue no. 13-210).
In a similar fashion to the derivation of low income cut-offs based upon total income before tax, cut-offs are estimated independently for economic families and persons not in economic families based upon family expenditure and income after tax. Consequently the low income after-tax cut-offs are set at after-tax income levels, differentiated by size of family and area of residence, where families spend 20 percentage points more of their after-tax income than the average family on food, shelter and clothing. Based on the 1992 Family Expenditure Survey, families spent 50%, on average, of their total income on necessities. The threshold was thus set to the income level where families spent 70% of their income on necessities.
The following is the 2010 matrix of low income before-tax cut-offs (LICO-BT):
Table 3.4 Low income before tax cut-offs (LICO-BT at 1992 base) for economic families and persons not in economic families, 2010
Reported in: 2011
Reported for: Economic families and persons aged 15 years and over not in economic families in private households
Question no.: Not applicable
Responses: Not applicable
Remarks: Low-income cut-off is one of a series of low-income lines used in the National Household Survey. See also Income status; Prevalence of low income; Low income gap; Severity of low income and Economic family total income.
Since their initial publication, Statistics Canada has clearly and consistently emphasized that the LICOs are not measures of poverty. Rather, LICOs reflect a consistent and well-defined methodology that identifies those who are substantially worse off than average. These measures have enabled Statistics Canada to report important trends, such as the changing composition of those below the LICOs over time.
The choice of using before or after-tax income cut-offs depends upon the analysis undertaken. The after-tax income cut-offs will take into account the reduced spending power of families because of income taxes paid.
Table 3.4 Low income before tax cut-offs (1992 base) for economic families and persons not in economic families, 2010
Source: Income Research Paper Series, Low-Income Lines 2010-2011, Statistics Canada Catalogue no. 75F0002MIE, 2012 no. 002.
Reported for: Economic families and persons aged 15 years and over not in economic families in private households
Question no.: Not applicable
Responses: Not applicable
Remarks: Low-income cut-off is one of a series of low-income lines used in the National Household Survey. See also Income status; Prevalence of low income; Low income gap; Severity of low income and Economic family total income.
Since their initial publication, Statistics Canada has clearly and consistently emphasized that the LICOs are not measures of poverty. Rather, LICOs reflect a consistent and well-defined methodology that identifies those who are substantially worse off than average. These measures have enabled Statistics Canada to report important trends, such as the changing composition of those below the LICOs over time.
The choice of using before or after-tax income cut-offs depends upon the analysis undertaken. The after-tax income cut-offs will take into account the reduced spending power of families because of income taxes paid.
Table 3.4 Low income before tax cut-offs (1992 base) for economic families and persons not in economic families, 2010
Size of area of residence | |||||
| Economic family size | Rural area | Small population centres with less than 30,000 persons | Medium population centres with a population between 30,000 and 99,999 persons | Large urban population centres | |
| Population between 100,000 and 499,999 | Population 500,000 persons or more | ||||
| Person not in an economic family | 15,583 | 17,729 | 19,375 | 19,496 | 22,637 |
| 2 persons | 19,400 | 22,070 | 24,120 | 24,269 | 28,182 |
| 3 persons | 23,849 | 27,132 | 29,652 | 29,836 | 34,646 |
| 4 persons | 28,957 | 32,943 | 36,003 | 36,226 | 42,065 |
| 5 persons | 32,842 | 37,363 | 40,833 | 41,086 | 47,710 |
| 6 persons | 37,041 | 42,140 | 46,054 | 46,339 | 53,808 |
| 7 or more persons | 41,240 | 46,916 | 51,274 | 51,591 | 59,907 |
Source: Income Research Paper Series, Low-Income Lines 2010-2011, Statistics Canada Catalogue no. 75F0002MIE, 2012 no. 002.
The Low-income measure after tax (LIM-AT) is a fixed percentage (50%) of median adjusted after-tax income of households observed at the person level, where 'adjusted' indicates that a household's needs are taken into account.
In simple terms, the Low-income measure after tax (LIM-AT) is a fixed percentage (50%) of median adjusted after-tax income of households observed at the person level, where 'adjusted' indicates that a household's needs are taken into account. Adjustment for household sizes reflects the fact that a household's needs increase as the number of members increase, although not necessarily by the same proportion per additional member.
The LIMs derivation begins by calculating the 'adjusted household income' for each household by dividing household income by the square root of the number of persons in the household, otherwise known as the 'equivalence scale.' This adjusted household income is assigned to each individual in the private household, and the median of the adjusted household income (where half of all individuals will be above it and half below) is determined over the population. The LIM for a household of one person is 50% of this median, and the LIMs for other sizes of households are equal to this value multiplied by their equivalence scale.
Unlike other low in lines, LIMs do not vary by size of area of residence.
Thresholds for specific household sizes are presented in Table 3.2 Low-income measures thresholds (LIM-AT, LIM-BT and LIM-MI) for households of Canada, 2010.
Reported in: 2011
Reported for: Private households
Question no.: Derived variable
Responses: Not applicable
Remarks: Low-income measure after tax (LIM-AT) is one of a series of low-income lines used in the National Household Survey. See also Income status; Prevalence of low income; Low-income gap; Severity of low income and Adjusted after-tax income of households.
Following the practice of many international organizations, Statistics Canada began to publish before- and after-tax low income measures (LIMs) in 1991. The LIM is intended as a reference for international comparisons.
After a comprehensive research of low income measures completed in 2008-2009, changes relating to the (1) accounting unit utilized, (2) unit of analysis and (3) equivalence scale were made.
(1) The household replaced the economic family as the accounting unit in which individuals pooled income to enjoy economies of scale. A household refers to a person or group of persons residing in a dwelling.
(2) The median began to be calculated over the population individuals, as opposed to over that of families or households. Resultantly, each person in the population is represented by its adjusted household income.
(3) In order to ensure international consistency, the equivalence scale was changed and adjusted household income was calculated by dividing household income by the square root of the number of members in the household.
The choice of using before- or after-tax low income measures depends upon the analysis undertaken. The after-tax low income measures will take into account the reduced spending power of households because of income taxes paid.
Since their initial publication, Statistics Canada has clearly and consistently emphasized that low income lines are not measures of poverty. Rather, low income lines reflect a consistent and well-defined methodology that identifies those who are substantially worse off than average. These measures have enabled Statistics Canada to report important trends, such as the changing composition of those below the low income lines over time.
For information on various low income concepts and adjusted household income see also 'Low income lines', Income Research Paper Series (Catalogue no.75F0002M, 2012 -No.-002)
Table 3.2 Low-income measures thresholds (LIM-AT, LIM-BT and LIM-MI) for households of Canada, 2010
Source: Statistics Canada, National Household Survey, 2011.
Reported for: Private households
Question no.: Derived variable
Responses: Not applicable
Remarks: Low-income measure after tax (LIM-AT) is one of a series of low-income lines used in the National Household Survey. See also Income status; Prevalence of low income; Low-income gap; Severity of low income and Adjusted after-tax income of households.
Following the practice of many international organizations, Statistics Canada began to publish before- and after-tax low income measures (LIMs) in 1991. The LIM is intended as a reference for international comparisons.
After a comprehensive research of low income measures completed in 2008-2009, changes relating to the (1) accounting unit utilized, (2) unit of analysis and (3) equivalence scale were made.
(1) The household replaced the economic family as the accounting unit in which individuals pooled income to enjoy economies of scale. A household refers to a person or group of persons residing in a dwelling.
(2) The median began to be calculated over the population individuals, as opposed to over that of families or households. Resultantly, each person in the population is represented by its adjusted household income.
(3) In order to ensure international consistency, the equivalence scale was changed and adjusted household income was calculated by dividing household income by the square root of the number of members in the household.
The choice of using before- or after-tax low income measures depends upon the analysis undertaken. The after-tax low income measures will take into account the reduced spending power of households because of income taxes paid.
Since their initial publication, Statistics Canada has clearly and consistently emphasized that low income lines are not measures of poverty. Rather, low income lines reflect a consistent and well-defined methodology that identifies those who are substantially worse off than average. These measures have enabled Statistics Canada to report important trends, such as the changing composition of those below the low income lines over time.
For information on various low income concepts and adjusted household income see also 'Low income lines', Income Research Paper Series (Catalogue no.75F0002M, 2012 -No.-002)
Table 3.2 Low-income measures thresholds (LIM-AT, LIM-BT and LIM-MI) for households of Canada, 2010
| Household size1 | After-tax income | Before-tax income | Market income |
| 1 person | 19,460 | 22,160 | 19,283 |
| 2 persons | 27,521 | 31,339 | 27,270 |
| 3 persons | 33,706 | 38,382 | 33,399 |
| 4 persons | 38,920 | 44,320 | 38,566 |
| 5 persons | 43,514 | 49,551 | 43,118 |
| 6 persons | 47,667 | 54,281 | 47,234 |
| 7 persons | 51,486 | 58,630 | 51,018 |
| 1To convert to other household sizes, multiply the value in the one-person household by the square root of the desiredhousehold size. | |||
Source: Statistics Canada, National Household Survey, 2011.
The Low-income measure before tax (LIM-BT) is a fixed percentage (50%) of median adjusted total income of households observed at the person level, where 'adjusted' indicates that a household's needs are taken into account.
In simple terms, the Low-income measure before tax (LIM-BT) is a fixed percentage (50%) of median adjusted total income of households observed at the person level, where 'adjusted' indicates that a household's needs are taken into account. Adjustment for household sizes reflects the fact that a household's needs increase as the number of members increase, although not necessarily by the same proportion per additional member.
The LIMs derivation begins by calculating the 'adjusted household income' for each household by dividing household income by the square root of the number of persons in the household, otherwise known as the 'equivalence scale.' This adjusted household income is assigned for each individual in the private household, and the median of the adjusted household income (where half of all individuals will be above it and half below) is determined over the population. The LIM for a household of one person is 50% of this median, and the LIMs for other sizes of households are equal to this value multiplied by their equivalence scale.
Unlike other low income lines, LIMs do not vary by size of area of residence.
Thresholds for specific household sizes are presented in Table 3.2 Low-income measures thresholds (LIM-AT, LIM-BT and LIM-MI) for households of Canada, 2010.
Reported in: 2011
Reported for: Private households
Question no.: Derived variable
Responses: Not applicable
Remarks: Low-income measure before tax (LIM-BT) is one of a series of low-income lines used in the National Household Survey. See lso Income status; Prevalence of low income; Low-income gap; Severity of low income and Adjusted total income of households.
Following the practice of many international organizations, Statistics Canada began to publish before- and after-tax low income measures (LIMs) in 1991. The LIM is intended as a reference for international comparisons.
After a comprehensive research of low income measures completed in 2008-2009, changes relating to the (1) accounting unit utilized, (2) unit of analysis and (3) equivalence scale were made.
(1) The household replaced the economic family as the accounting unit in which individuals pooled income to enjoy economies of scale. A household refers to a person or group of persons residing in a dwelling.
(2) The median began to be calculated over the population individuals, as opposed to over that of families or households. Resultantly, each person in the population is represented by its adjusted household income.
(3) In order to ensure international consistency, the equivalence scale was changed and adjusted household income was calculated by dividing household income by the square root of the number of members in the household.
The choice of using before- or after-tax low income measures depends upon the analysis undertaken. The after-tax low income measures will take into account the reduced spending power of households because of income taxes paid.
Since their initial publication, Statistics Canada has clearly and consistently emphasized that low income lines are not measures of poverty. Rather, low income lines reflect a consistent and well-defined methodology that identifies those who are substantially worse off than average. These measures have enabled Statistics Canada to report important trends, such as the changing composition of those below the low income lines over time.
For information on various low income concepts and adjusted household income see also 'Low income lines', Income Research Paper Series (Catalogue no. 75F0002M, 2012 - No. 002).
The Low-income measure of market income (LIM-MI) is a fixed percentage (50%) of median adjusted market income of households observed at the person level, where 'adjusted' indicates that a household's needs are taken into account.
In simple terms, the Low-income measure of market income (LIM-MI) is a fixed percentage (50%) of median adjusted market income of households observed at the person level, where 'adjusted' indicates that a household's needs are taken into account. Adjustment for household sizes reflects the fact that a household’s needs increase as the number of members increase, although not necessarily by the same proportion per additional member.
The LIMs derivation begins by calculating the 'adjusted household income' for each household by dividing household income by the square root of the number of persons in the household, otherwise known as the 'equivalence scale.' This adjusted household income is assigned to each individual in the private household, and the median of the adjusted household income (where half of all individuals will be above it and half below) is determined over the population. The LIM for a household of one person is 50% of this median, and the LIMs for other sizes of households are equal to this value multiplied by their equivalence scale.
Unlike other low income lines, LIMs do not vary by size of area of residence.
Thresholds for specific household sizes are presented in Table 3.2 Low-income measures thresholds (LIM-AT, LIM-BT and LIM-MI) for households of Canada, 2010.
Reported in: 2011
Reported for: Private households
Question no.: Not applicable
Responses: Not applicable
Remarks: Low-income measure of market income (LIM-MI) is one of a series of low-income lines used in the National Household Survey. See also Income status; Prevalence of low income; Low-income gap; Severity of low income and Adjusted after-tax income of households.
Following the practice of many international organizations, Statistics Canada began to publish before- and after-tax low income measures (LIMs) in 1991. The LIM is intended as a reference for international comparisons.
After a comprehensive research of low income measures completed in 2008-2009, changes relating to the (1) accounting unit utilized, (2) unit of analysis and (3) equivalence scale were made.
(1) The household replaced the economic family as the accounting unit in which individuals pooled income to enjoy economies of scale. A household refers to a person or group of persons residing in a dwelling.
(2) The median began to be calculated over the population individuals, as opposed to over that of families or households. Resultantly, each person in the population is represented by its adjusted household income.
(3) In order to ensure international consistency, the equivalence scale was changed and adjusted household income was calculated by dividing household income by the square root of the number of members in the household.
The choice of using before- or after-tax low income measures depends upon the analysis undertaken. The after-tax low income measures will take into account the reduced spending power of households because of income taxes paid.
Since their initial publication, Statistics Canada has clearly and consistently emphasized that low income lines are not measures of poverty. Rather, low income lines reflect a consistent and well-defined methodology that identifies those who are substantially worse off than average. These measures have enabled Statistics Canada to report important trends, such as the changing composition of those below the low income lines over time.
For information on various low income concepts and adjusted household income see also 'Low Income Lines, 2011-2012', Income Research Paper Series (Catalogue no. 75F0002M, 2012 – No. 002).
Refers to that income source, or group of sources, that makes up the largest proportion of an individual's total income.
Refers to that component which constitutes the largest proportion of an income recipient's total income. Various combinations of income sources can be used to derive this classification. For example, at the most detailed level, the income sources are combined into five components: wages and salaries, self-employment income (farm and non-farm), government transfer payments, investment income and other income. The absolute values for these components are compared and the largest one is designated as the major source of income.
Refers to the sum of employment income (wages and salaries, net farm income and net income from a non-farm unincorporated business and/or professional practice), investment income, retirement pensions, superannuation and annuities (including those from Registered Retirement Savings Plans [RRSPs] and Registered Retirement Income Funds [RRIFs]) and other money income. It is equivalent to total income minus all government transfer payments. It is also referred to as income before transfers and taxes.
Reported in: 2011
Reported for: Population aged 15 years and over in private households
Question no.: Derived variable based upon responses to Questions 54 and 55(a) to (c) and (i), (k) and (l)br />
Responses: Positive or negative dollar value or nil
Remarks: This variable does not include net capital gains or losses. Though these are asked on the questionnaire, they are not part of the standard income definition.
See the definitions for each of the components.
Based on concepts developed by Human Resources and Skills Development Canada (HRSDC), the Market Basket Measure (MBM) is a measure of low income based on the cost of a specified basket of goods and services representing a modest, basic standard of living.
Based on concepts developed by Human Resources and Skills Development Canada (HRSDC), the Market Basket Measure (MBM) is a measure of low income based on the cost of a specified basket of goods and services representing a modest, basic standard of living. Taken into consideration are the costs of specified qualities and quantities of food, clothing, footwear, transportation, a shelter and other expenses for a reference family of two adults aged 25 to 49 and two children aged 9 and 13.
A key feature of the MBM is that it is more sensitive than other low-income measures to geographical variations in the cost of many typical items of expenditure. Calculated for 19 specific communities and 30 population centre size and province combinations, the MBM threshold recognizes differences in the cost of the basket between similar sized communities in different provinces and between different geographical regions within provinces.
An important concept underlying the MBM is that the income to be compared to the thresholds should not be gross income, but rather a measure of the income closer to what is actually available to purchase these goods and services. Certain deductions must be made, for payments or outlays that are considered non discretionary as they represent income that is not available to purchase the goods and services in the basket. Thus, the income compared to the basket cost is the disposable income for the MBM.
In calculating the MBM thresholds, the equivalence scale used is the square root of economic family size. This method adjusts the threshold for families of a different size.
Presented below is the matrix of Market Basket Measure (MBM) thresholds for 2010:
Table 3.5 Market Basket Measure (MBM) thresholds for economic families and persons not in economic families, 2010
Reported in: Not applicable
Reported for: Not applicable
Question no.: Not applicable
Responses: Not applicable
Remarks: The MBM and the MBM disposable income were designed by a working group of federal, provincial and territorial officials, led by Human Resources and Skills Development Canada (HRSDC) between 1997 and 1999 (Hatfield 2002; Michaud, Cotton and Bishop 2004). During 2009 and early 2010, it underwent a comprehensive review of both content and methodology (Hatfield, Pyper and Gustajtis 2010). The consultation process, led by HRSDC, involved officials from provincial and territorial governments, other federal government departments and agencies, including Statistics Canada, and a panel of experts in low-income measurement. This review process led to a rebased series of thresholds (MBM, 2008 base), revised historically to 2000, the beginning of the MBM time series. Among the changes to the MBM resulting from the comprehensive review was the revision of the shelter component to include the costs of homeowners without mortgages. This revision recognized that, in a given year, homeowners without mortgages may pay less for shelter than they would if they were renting.
During 2012, HRSDC officials re-examined the methodology for including homeowners without mortgages in order to better implement the conceptual decision to reflect these costs in the MBM. Following this re-examination, a revised methodology was adopted that adjusts the MBM disposable income of homeowners without mortgages to account for the potential differences in their shelter-related expenses.
The NHS uses this 2012-based MBM.
While HRSDC was responsible for defining the components of the basket, Statistics Canada collects the data on the cost of goods and services in the basket to calculate thresholds and produce low-income statistics.
See also Prevalence of low income, Income status, Low-income gap and Severity of low income.
Refer to the data quality notes in the Income Reference Guide, National Household Survey, 2011.
Table 3.5 Market Basket Measure (MBM) thresholds for economic families and persons not in economic families, 2010
Note: The geographic area concepts and the Market Basket Measure (MBM) thresholds were defined by Human Resources and Skills Development Canada (HRSDC). This amount corresponds to the cost of a specific basket of goods and services representing a modest, basic standard of living in each of the 49 MBM geographic regions.
1To convert to other family sizes, multiply the amount for persons not in economic families by the square root of the desired family size.
Source: Statistics Canada, Income Statistics Division.
Reported for: Not applicable
Question no.: Not applicable
Responses: Not applicable
Remarks: The MBM and the MBM disposable income were designed by a working group of federal, provincial and territorial officials, led by Human Resources and Skills Development Canada (HRSDC) between 1997 and 1999 (Hatfield 2002; Michaud, Cotton and Bishop 2004). During 2009 and early 2010, it underwent a comprehensive review of both content and methodology (Hatfield, Pyper and Gustajtis 2010). The consultation process, led by HRSDC, involved officials from provincial and territorial governments, other federal government departments and agencies, including Statistics Canada, and a panel of experts in low-income measurement. This review process led to a rebased series of thresholds (MBM, 2008 base), revised historically to 2000, the beginning of the MBM time series. Among the changes to the MBM resulting from the comprehensive review was the revision of the shelter component to include the costs of homeowners without mortgages. This revision recognized that, in a given year, homeowners without mortgages may pay less for shelter than they would if they were renting.
During 2012, HRSDC officials re-examined the methodology for including homeowners without mortgages in order to better implement the conceptual decision to reflect these costs in the MBM. Following this re-examination, a revised methodology was adopted that adjusts the MBM disposable income of homeowners without mortgages to account for the potential differences in their shelter-related expenses.
The NHS uses this 2012-based MBM.
While HRSDC was responsible for defining the components of the basket, Statistics Canada collects the data on the cost of goods and services in the basket to calculate thresholds and produce low-income statistics.
See also Prevalence of low income, Income status, Low-income gap and Severity of low income.
Refer to the data quality notes in the Income Reference Guide, National Household Survey, 2011.
Table 3.5 Market Basket Measure (MBM) thresholds for economic families and persons not in economic families, 2010
| MBM region | Persons not in economic families | Economic family size1 | |||
| 2 persons | 3 persons | 4 persons | 5 persons | ||
| Newfoundland and Labrador | |||||
| Rural areas | 17,577 | 24,857 | 30,443 | 35,153 | 39,302 |
| Small population centres with less than 30,000 persons | 17,827 | 25,211 | 30,877 | 35,654 | 39,862 |
| St. John's (CMA) | 17,005 | 24,049 | 29,454 | 34,010 | 38,024 |
| Prince Edward Island | |||||
| Rural areas | 17,082 | 24,157 | 29,586 | 34,163 | 38,195 |
| Small population centres with less than 30,000 persons | 17,478 | 24,718 | 30,273 | 34,956 | 39,082 |
| Charlottetown (CA) | 16,858 | 23,841 | 29,199 | 33,716 | 37,696 |
| Nova Scotia | |||||
| Rural areas | 17,561 | 24,835 | 30,417 | 35,122 | 39,268 |
| Small population centres with less than 30,000 persons | 17,647 | 24,956 | 30,565 | 35,293 | 39,459 |
| Medium population centres with a population between 30,000 and 99,999 persons | 16,775 | 23,723 | 29,054 | 33,549 | 37,509 |
| Halifax (CMA) | 17,288 | 24,448 | 29,943 | 34,575 | 38,656 |
| Cape Breton (CA) | 16,325 | 23,087 | 28,276 | 32,650 | 36,504 |
| New Brunswick | |||||
| Rural areas | 17,223 | 24,357 | 29,831 | 34,446 | 38,512 |
| Small population centres with less than 30,000 persons | 17,494 | 24,740 | 30,300 | 34,988 | 39,118 |
| Medium population centres with a population between 30,000 and 99,999 persons | 17,220 | 24,352 | 29,825 | 34,439 | 38,504 |
| Fredericton (CA) | 17,419 | 24,634 | 30,171 | 34,838 | 38,950 |
| Saint John (CMA) | 16,347 | 23,118 | 28,314 | 32,694 | 36,553 |
| Moncton (CMA) | 16,364 | 23,141 | 28,342 | 32,727 | 36,590 |
| Quebec | |||||
| Rural areas | 15,437 | 21,831 | 26,738 | 30,874 | 34,518 |
| Small population centres with less than 30,000 persons | 15,479 | 21,890 | 26,810 | 30,957 | 34,611 |
| Medium population centres with a population between 30,000 and 99,999 persons | 14,641 | 20,706 | 25,359 | 29,282 | 32,738 |
| Large urban population centres with a population between 100,000 and 499,999 persons | 15,027 | 21,251 | 26,027 | 30,053 | 33,600 |
| Québec (CMA) | 15,280 | 21,608 | 26,465 | 30,559 | 34,166 |
| Montréal (CMA) | 15,794 | 22,336 | 27,356 | 31,588 | 35,316 |
| Ontario | |||||
| Rural areas | 16,405 | 23,200 | 28,414 | 32,810 | 36,683 |
| Small population centres with less than 30,000 persons | 16,309 | 23,064 | 28,248 | 32,618 | 36,468 |
| Medium population centres with a population between 30,000 and 99,999 persons | 15,201 | 21,497 | 26,329 | 30,402 | 33,990 |
| Large urban population centres with a population between 100,000 and 499,999 persons | 16,034 | 22,676 | 27,772 | 32,068 | 35,853 |
| Ottawa - Gatineau (Ontario part) (CMA) | 17,555 | 24,826 | 30,405 | 35,109 | 39,253 |
| Hamilton (CMA) | 16,364 | 23,141 | 28,342 | 32,727 | 36,590 |
| Toronto (CMA) | 18,431 | 26,065 | 31,923 | 36,861 | 41,212 |
| Manitoba | |||||
| Rural areas | 15,725 | 22,239 | 27,236 | 31,450 | 35,162 |
| Small population centres with less than 30,000 persons | 16,361 | 23,137 | 28,337 | 32,721 | 36,583 |
| Brandon (CA) | 15,360 | 21,722 | 26,603 | 30,719 | 34,345 |
| Winnipeg (CMA) | 16,010 | 22,641 | 27,729 | 32,019 | 35,798 |
| Saskatchewan | |||||
| Rural areas | 16,269 | 23,008 | 28,179 | 32,538 | 36,379 |
| Small population centres with less than 30,000 persons | 16,755 | 23,695 | 29,021 | 33,510 | 37,465 |
| Medium population centres with a population between 30,000 and 99,999 persons | 15,499 | 21,918 | 26,844 | 30,997 | 34,656 |
| Saskatoon (CMA) | 16,531 | 23,378 | 28,632 | 33,061 | 36,963 |
| Regina (CMA) | 15,939 | 22,540 | 27,606 | 31,877 | 35,640 |
| Alberta | |||||
| Rural areas | 17,372 | 24,568 | 30,089 | 34,744 | 38,845 |
| Small population centres with less than 30,000 persons | 18,032 | 25,501 | 31,232 | 36,064 | 40,321 |
| Medium population centres with a population between 30,000 and 99,999 persons | 17,431 | 24,651 | 30,191 | 34,862 | 38,977 |
| Edmonton (CMA) | 17,040 | 24,097 | 29,513 | 34,079 | 38,101 |
| Calgary (CMA) | 17,906 | 25,323 | 31,014 | 35,812 | 40,039 |
| British Columbia | |||||
| Rural areas | 17,311 | 24,481 | 29,983 | 34,621 | 38,707 |
| Small population centres with less than 30,000 persons | 17,318 | 24,491 | 29,996 | 34,636 | 38,724 |
| Medium population centres with a population between 30,000 and 99,999 persons | 16,287 | 23,033 | 28,210 | 32,574 | 36,419 |
| Large urban population centres with a population between 100,000 and 499,999 persons | 17,666 | 24,983 | 30,598 | 35,331 | 39,501 |
| Vancouver (CMA) | 18,261 | 25,825 | 31,629 | 36,522 | 40,833 |
Note: The geographic area concepts and the Market Basket Measure (MBM) thresholds were defined by Human Resources and Skills Development Canada (HRSDC). This amount corresponds to the cost of a specific basket of goods and services representing a modest, basic standard of living in each of the 49 MBM geographic regions.
1To convert to other family sizes, multiply the amount for persons not in economic families by the square root of the desired family size.
Source: Statistics Canada, Income Statistics Division.
Net capital gains or losses received from the sale of capital property, including mutual funds.
Refers to the net gains (the proceeds of disposition minus adjusted cost base of the property as well as outlays and expenses incurred to sell that property) received during calendar year 2010 from the sale of capital property.
Capital property includes mutual funds, depreciable property and any property which, if sold, would result in a capital gain or loss, for example, cottages, buildings, and securities.
Included with adjusted cost base are any expenses incurred to acquire the property and capital expenditures made toward property improvements with the exception of those that are current, such as ongoing repair or maintenance costs.
Non-taxable capital gains or losses on the sale of a principal residence are excluded.
Reported in: 2011
Reported for: Population aged 15 years and over in private households
Question no.: Direct variable: Questions 54 and 55(j)
Responses: Positive or negative dollar value or nil
Remarks: Introduced in 2011, this variable was previously mentioned in the census as an exclusion to investment income. It is not considered in the regular concept of total income as disseminated in standard products. It is instead included in an alternate variable Total income plus net capital gains or losses.
Net income earned by working for oneself (self-employment) as an owner/operator of his/her farm.
Refers to net income (gross receipts from farm sales minus depreciation and cost of operation) received during calendar year 2010 from the operation of a farm, either on the respondent's own account or in partnership. In the case of partnerships, only the respondent's share of income was reported. Included with gross receipts are cash advances received in 2010, dividends from cooperatives, rebates and farm-support payments to farmers from federal, provincial and regional agricultural programs (for example, milk subsidies and marketing board payments) and gross insurance proceeds such as payments from the AgriInvest and AgriStability programs. The value of income 'in kind,' such as agricultural products produced and consumed on the farm, is excluded.
Net income earned by working for oneself (self-employment) as an owner/operator of his/her non-farm business.
Refers to net income (gross receipts minus expenses of operation such as wages, rents and depreciation) received during calendar year 2010 from the respondent's non-farm unincorporated business or professional practice. In the case of partnerships, only the respondent's share was reported. Also included is net income from persons babysitting in their own homes, persons providing room and board to non-relatives, self-employed fishers, hunters and trappers, operators of direct distributorships such as those selling and delivering cosmetics, as well as freelance activities of artists, writers, music teachers, hairdressers, dressmakers, etc.
Non-discretionary spending for the MBM includes mandatory payroll deductions such as contributions to employer-sponsored pension plans, supplementary health plans and union dues; child and spousal support paid to another family; out-of-pocket spending on child care; and non-insured but medically prescribed health-related expenses such as dental and vision care, prescription drugs, and aids for persons with disabilities.
The conceptual contents of this variable were defined by Human Resources and Skills Development Canada (HRSDC) for the purposes of computing the disposable income for the MBM.
Non-discretionary spending for the MBM at the economic family level is the sum of non-discretionary spending for the MBM of all economic family members.
Reported in: 2011
Reported for: Economic families and persons not in economic families aged 15 years and over in private households
Question no.: Derived variable
Responses: Not applicable
Remarks: Two components were derived from responses to spending questions on the NHS. See Child care expenses paid and Child or spousal support payments.
The other items were either based on tax file deductions for respondents who instructed to use their tax records or were imputed for remaining respondents.
Refers to Old Age Security pension (OAS), Guaranteed Income Supplement (GIS), Allowance and Allowance for the Survivor received in 2010.
Refers to Old Age Security pension and Guaranteed Income Supplement paid to persons aged 65 years and over, and to the Allowance or Allowance for the Survivor paid to 60 to 64 year-old spouses old age security recipients or widow(er)s by the federal government during the calendar year 2010.
Reported in: 2011
Reported for: Population aged 15 years and over in private households
Question no.: Direct variable: Questions 54 and 55(e)
Responses: Dollar value or nil
Remarks: Provincial income supplements to seniors are included in Other income from government sources.
Retirement pensions to civil servants, Royal Canadian Mounted Police (RCMP) and military personnel are included in Retirement pensions, superannuation and annuities, including those from RRSPs and RRIFs.
The amount to be repaid based on net income when filing a tax return is excluded.
See also 'Remarks' under Total income.
Refers to all transfer payments, excluding those covered as a separate income source (Canada Pension Plan or Quebec Pension Plan benefits, Old Age Security pension and Guaranteed Income Supplement, Employment Insurance benefits and child benefits) received from federal, provincial, territorial or municipal programs during the 2010 calendar year.
Refers to all transfer payments, excluding those covered as a separate income source (Canada Pension Plan or Quebec Pension Plan benefits, Old Age Security pension and Guaranteed Income Supplement, Employment Insurance benefits and child benefits) received from federal, provincial, territorial or municipal programs during the calendar year 2010. This source includes social assistance payments received by persons in need, such as mothers with dependent children, persons temporarily or permanently unable to work, elderly individuals, the blind and persons with disabilities. Included are provincial income supplement payments to seniors and provincial payments to help offset accommodation costs. Also included are other transfer payments, such as payments received from training programs sponsored by the federal and provincial governments, veterans' pensions, war veterans' allowance, pensions to widows and dependants of veterans, and workers' compensation. Additionally, refundable provincial tax credits and refunds of the Goods and Services Tax (GST) or the Harmonized Sales Tax (HST), Quebec Solidarity Tax Credit, Saskatchewan Low-Income Tax Credit received in 2010 are included.
Refers to regular cash income received during calendar year 2010 and not reported in any of the other eleven sources listed on the questionnaire. For example, severance pay and retirement allowances, alimony, child support, periodic support from other persons not in the household, income from abroad (excluding dividends and interest), non-refundable scholarships, bursaries, fellowships and study grants, and artists' project grants are included.
Percentage of persons, economic families, persons not in an economic family aged 15 years or over or households in low income according to one of the low-income lines.
The prevalence of low income is the proportion or percentage of units whose income falls below a specified low income line.
Reported in: 2011
Reported for: Population in private households and, according to the low-income line used, economic families, persons aged 15 years and over not in economic families in private households, or private households.
Question no.: Derived statistic
Responses: Percentage values
Remarks: Six different low-income lines are defined in the National Household Survey, though, the Low-income measure after-tax income (LIM-AT) is always the one used for standard products.
See Income status and related low-income line definitions.
Prevalence of low income is usually defined on the population in private households but can also be derived for different units of analysis.
This statistic is not resident on the database.
Regular income received as a pension from a former employer or in the form of an annuity or payment from a Registered Retirement Income Fund (RRIF) or a matured Registered Retirement Savings Plan (RRSP).
Refers to all regular income received by the respondent during calendar year 2010 as the result of having been a member of a pension plan of one or more employers. It includes payments received from all annuities, including payments from a Registered Retirement Income Fund (RRIF), a matured Registered Retirement Savings Plan (RRSP) in the form of a life annuity, a fixed-term annuity or an income-averaging annuity contract; pensions paid to widow(er)s or other relatives of deceased pensioners; pensions of retired civil servants, Armed Forces personnel and Royal Canadian Mounted Police (RCMP) officers; annuity payments received from the Canadian Government Annuities Program, an insurance company, etc. Does not include lump-sum death benefits, lump-sum benefits or withdrawals from a pension plan or RRSP or refunds of overcontributions.
Total net income earned by working for oneself (self-employment) as an owner/operator of his/her business or farm.
Total income received by persons 15 years of age and over during calendar year 2010 as net farm income from self-employment, or net non-farm income from unincorporated business and/or professional practice.
Reported in: 2011
Reported for: Population aged 15 years and over in private households
Question no.: Derived variable: Questions 54 and 55 (b) and (c)
Responses: Positive or negative dollar value or nil
Remarks: See 'Remarks' under Total income.
See also the detailed definitions for each of the components.
Reported for: Population aged 15 years and over in private households
Question no.: Derived variable: Questions 54 and 55 (b) and (c)
Responses: Positive or negative dollar value or nil
Remarks: See 'Remarks' under Total income.
See also the detailed definitions for each of the components.
The low-income severity is the square of the low-income gap ratio. The low-income gap ratio expresses the income required to bring a unit up to the low-income line as a percentage of the line.
This statistic is zero if the income is at or above the line and is one if the income is zero or negative. It tends to emphasize situations where the gap is larger.
This statistic is zero if the income is at or above the line and is one if the income is zero or negative. It tends to emphasize situations where the gap is larger.
Reported in: 2011
Reported for: Not applicable
Question no.: Not applicable
Responses: Not applicable
Remarks: Severity of low income is available for each of the six low-income lines used in the National Household Survey.
See also Income status, Prevalence of low income and Low-income gap.
Reported for: Not applicable
Question no.: Not applicable
Responses: Not applicable
Remarks: Severity of low income is available for each of the six low-income lines used in the National Household Survey.
See also Income status, Prevalence of low income and Low-income gap.
Total of income from all sources, including employment income, income from government programs, pension income, investment income and any other money income.
Total income refers to monetary receipts from certain sources, before income taxes and deductions, during a calendar year 2010. It includes employment income from wages, salaries, tips, commissions and net income from self-employment (for both unincorporated farm and non-farm activities); income from government sources, such as social assistance, child benefits, employment insurance, Old Age Security pension, Canada or Quebec pension plan benefits and disability income; income from employer and personal pension sources, such as private pensions and payments from annuities and RRIFs; income from investment sources, such as dividends and interest on bonds, accounts, GICs and mutual funds; and other regular cash income, such as child support payments received, spousal support payments (alimony) received and scholarships. The monetary receipts included are those that tend to be of a regular and recurring nature. It excludes one-time receipts, such as:
lottery winnings, gambling winnings, cash inheritances, lump sum insurance settlements, capital gains and RRSP withdrawals. Capital gains are excluded because they are not by their nature regular and recurring. It is further assumed that they are less likely to be fully spent in the period in which they are received, unlike income that is regular and recurring. Also excluded are employer's contributions to registered pension plans, Canada and Quebec pension plans, and employment insurance. Finally, voluntary inter-household transfers, imputed rent, goods and services produced for barter, and goods produced for own consumption are excluded from this total income definition.
Reported in: 2011
Reported for: Population aged 15 years and over in private households
Question no.: Derived variable. Questions 54 and 55
Responses: Positive or negative dollar value or nil
Remarks: Respondents were asked a direct question on their total income including capital gains or losses. As the concept excludes capital gains or losses, total income was derived excluding these amounts. For persons allowing access to their income tax data, the total income was derived from amounts reported on their 2010 income tax and benefit returns and administrative Canada Child Tax Benefit files.
For records with information from administrative data, some taxable in-kind benefits may be involuntarily included and some non-taxable sources of income may be involuntarily excluded.
For more information on the quality of the data, please refer to the appropriate section in the Income Reference Guide.
This definition is conceptually equivalent to that on the 2006 Census. The population covered however are different. In the 2006 Census, the universe also included persons aged 15 years and over living in collective non-institutional dwellings.
See also After-tax income.
Figure 3.1 Components of income in 2010
This is a non-standard definition of income designed for specific analyses that adds net capital gains or losses to the standard total income.
Refers to gross wages and salaries before deductions for such items as income tax, pensions and Employment Insurance. Included in this source are military pay and allowances, tips, commissions and cash bonuses, benefits from wage-loss replacement plans or income-maintenance insurance plans, supplementary unemployment benefits from an employer or union as well as all types of casual earnings during calendar year 2010. Other employment income such as taxable benefits, research grants and royalties are included.
Refers to yearly payments (last 12 months) for oil, gas, coal, wood or other fuels.
Refers to yearly payments (last 12 months) for water and other municipal services.
Refers to yearly property taxes (municipal and school) for an owner-occupied dwelling when reported separately from mortgage or loan payments.
Reported in: 2011
Reported for: Private households in owner-occupied non-farm dwellings
Question no.: Direct variable: Question E10(c)
Responses: None; Dollar value
Remarks: Includes local improvement taxes as well, even if billed separately.
See the Owner's major payments definition.
Reported for: Private households in owner-occupied non-farm dwellings
Question no.: Direct variable: Question E10(c)
Responses: None; Dollar value
Remarks: Includes local improvement taxes as well, even if billed separately.
See the Owner's major payments definition.
Refers to rooms in a private dwelling that are designed mainly for sleeping purposes even if they are now used for other purposes, such as guest rooms and television rooms. Also included are rooms used as bedrooms now, even if they were not originally built as bedrooms, such as bedrooms in a finished basement.
Bedrooms exclude rooms designed for another use during the day such as dining rooms and living rooms even if they may be used for sleeping purposes at night. By definition, one-room private dwellings such as studio apartments have zero bedrooms.
Bedrooms exclude rooms designed for another use during the day such as dining rooms and living rooms even if they may be used for sleeping purposes at night. By definition, one-room private dwellings such as studio apartments have zero bedrooms.
Refers to whether the dwelling is in need of repairs. This does not include desirable remodelling or additions.
Reported in: 2011
Reported for: Private dwellings occupied by usual residents
Question no.: Direct variable: Question E6
Responses: No, only regular maintenance is needed; Yes, minor repairs are needed; Yes, major repairs are needed
Remarks: The 'regular maintenance needed' category includes dwellings where only regular maintenance such as painting or furnace cleaning is required.
The 'minor repairs needed' category includes dwellings needing only minor repairs such as dwellings with missing or loose floor tiles, bricks or shingles or defective steps, railing or siding.
The 'major repairs needed' category includes dwellings needing major repairs such as dwellings with defective plumbing or electrical wiring and dwellings needing structural repairs to walls, floors or ceilings.
Refers to monthly payments for maintenance and various condominium services.
Reported in: 2011
Reported for: Private households in owner-occupied non-farm dwellings which form part of a condominium development
Question no.: Direct variable: Question E10(e)
Responses: None; Dollar value
Remarks: Although the condominium status question is asked to owner and renter households, the condominium fee question is only asked to owners. Renters of condominiums are not usually responsible for the direct payment of condominium fees.
See the Condominium status and Owner's major payments definitions.
Refers to whether the private dwelling is part of a condominium development. A condominium is a residential complex in which dwellings are owned individually while land and common elements are held in joint ownership with others.
Refers to whether or not a person residing in the household is responsible for paying the rent, or the mortgage, or the taxes, or the electricity or other services or utilities. Where a number of people may contribute to the payments, more than one person in the household may be identified as a household maintainer. If no person in the household is identified as making such payments, the reference person is identified by default.
Reported in: 2011
Reported for: Private households
Question no.: Derived variable: Question E1
Responses: Not applicable
Remarks: Up to five household maintainers can be identified.
In order for a person identified as being responsible for the household payments to be considered as the household maintainer, that person must be 15 years of age or older and be related to Person 1 in terms other than as an employee (or as an employee's census family).
Housing suitability refers to whether a private household is living in suitable accommodations according to the National Occupancy Standard (NOS); that is, whether the dwelling has enough bedrooms for the size and composition of the household. A household is deemed to be living in suitable accommodations if its dwelling has enough bedrooms, as calculated using the NOS.
Housing suitability assesses the required number of bedrooms for a household based on the age, sex, and relationships among household members. An alternative variable, the number of persons per room, considers all rooms in a private dwelling and the number of household members.
Housing suitability and the National Occupancy Standard (NOS) on which it is based were developed by Canada Mortgage and Housing Corporation (CMHC) through consultations with provincial housing agencies.
Reported in: 2011
Reported for: Private households
Question no.: Derived variable: Questions 2, 3, 4, 5, 6 and E4(b)
Responses: In the standard products, the most detailed classification is as follows:
Suitable
Not suitable
One bedroom shortfall
Two bedroom shortfall
Three or more bedroom shortfall
Remarks: The NOS derives the number of bedrooms a household requires as follows:
- A maximum of two persons per bedroom.
- Household members, of any age, living as part of a married or common-law couple share a bedroom with their spouse or common-law partner.
- Lone-parents, of any age, have a separate bedroom.
- Household members aged 18 or over have a separate bedroom, except those living as part of a married or common-law couple.
- Household members under 18 years of age of the same sex share a bedroom, except lone-parents and those living as part of a married or common-law couple.
- Household members under 5 years of age of the opposite sex share a bedroom if doing so would reduce the number of required bedrooms. This situation would arise only in households with an odd number of males under 18, an odd number of females under 18, and at least one female and one male under the age of 5.
Reported in: 2011
Reported for: Private households in owner-occupied non-farm dwellings
Question no.: Direct variable: Question E10(a)
Responses: None; Dollar value
Remarks: In cases where mortgage payments are made in increments other than monthly (e.g., bi-weekly), all payments made in that year are added and then divided by 12, to obtain the average monthly amount paid.
See the definition Owner's major payments.
Refers to an indicator of the level of crowding in a private dwelling. It is calculated by dividing the number of persons in the household by the number of rooms in the dwelling.
Reported in: 2011
Reported for: Private households
Question no.: Derived variable: Question E4(a)
Responses: In the standard products, the most detailed classification is as follows:
One person or fewer per room
More than 1 person per room
More than 1 but less than 1.50
1.50 persons or more
Remarks: Persons per room is a measure of crowding that considers all rooms in a private dwelling and the number of household members. A higher value of 'persons per room' indicates a higher level of crowding.
An alternative measure is the housing suitability1 according to the National Occupancy Standard (NOS) which assesses the required number of bedrooms for a household based on the age, sex, and relationships among household members.
1. Housing suitability and the National Occupancy Standard (NOS) on which it is based were developed by Canada Mortgage and Housing Corporation (CMHC) through consultations with provincial housing agencies.
Average monthly total of all shelter expenses paid by households that own their dwelling. The owner's major payments include, where applicable, the mortgage payment, the costs of electricity, heat, water and other municipal services, property taxes and condominium fees.
Reported in: 2011
Reported for: Private households in owner-occupied non-farm dwellings
Question no.: Derived variable: Questions E8(a), (b), (c), E10(a), (c) and (e)
Responses: Dollar value
Remarks: The term shelter costs refers to 'Owner's major payments' for owner households and 'Gross rent' for tenant households.
Refers to the period in time during which the building or dwelling was originally constructed.
Reported in: 2011
Reported for: Private dwellings occupied by usual residents
Question no.: Direct variable: Question E5
Responses: 1920 or before; 1921 to 1945; 1946 to 1960; 1961 to 1970; 1971 to 1980; 1981 to 1985; 1986 to 1990; 1991 to 1995; 1996 to 2000; 2001 to 2005; 2006 to 20111
1Up to May 10, 2011.
Remarks: This refers to the period in which the building was originally built, not the time of any later remodelling, additions or conversions. Respondents were asked to indicate the period of construction, to the best of their knowledge.
First person in the household identified as someone who pays the rent or the mortgage, or the taxes, or the electricity bill, and so on, for the dwelling.
The first person in the household identified as being a household maintainer.
The order of the persons in a household is determined by the order in which the respondent lists the persons on the questionnaire. Generally, an adult is listed first followed, if applicable, by that person's spouse or common-law partner and by their children. The order does not necessarily correspond to the proportion of household payments made by the person.
The order of the persons in a household is determined by the order in which the respondent lists the persons on the questionnaire. Generally, an adult is listed first followed, if applicable, by that person's spouse or common-law partner and by their children. The order does not necessarily correspond to the proportion of household payments made by the person.
Refers to whether property taxes (municipal and school) are included in the total regular monthly mortgage or loan payments for a dwelling.
Average monthly total of all shelter expenses paid by households that rent their dwelling. Gross rent includes, where applicable, the monthly rent and the costs of electricity, heat, water and other municipal services.
Reported in: 2011
Reported for: Private households in tenant-occupied non-farm dwellings
Question no.: Derived variable: Questions E8(a), (b), (c) and E9(a)
Responses: Dollar value
Remarks: The term shelter costs refers to 'Owner's major payments' for owner households and 'Gross rent' for tenant households.
Reported for: Private households in tenant-occupied non-farm dwellings
Question no.: Derived variable: Questions E8(a), (b), (c) and E9(a)
Responses: Dollar value
Remarks: The term shelter costs refers to 'Owner's major payments' for owner households and 'Gross rent' for tenant households.
Reported in: 2011
Reported for: Private households in tenant-occupied non-farm dwellings
Question no.: Direct variable: Question E9(a)
Responses: Rented without payment of cash rent; Dollar value
Remarks: Also included are parking fees paid with the rent, if any.
See the Rent, gross definition.
Reported for: Private households in tenant-occupied non-farm dwellings
Question no.: Direct variable: Question E9(a)
Responses: Rented without payment of cash rent; Dollar value
Remarks: Also included are parking fees paid with the rent, if any.
See the Rent, gross definition.
Refers to enclosed areas within a private dwelling which are finished and suitable for year round living. The number of rooms of a private dwelling includes kitchens, bedrooms and finished rooms in the attic or basement.
The number of rooms of a private dwelling excludes bathrooms, halls, vestibules and rooms used solely for business purposes. Partially divided rooms are considered to be separate rooms if they are considered as such by the respondent (e.g., L-shaped diningroom and livingroom arrangements).
The number of rooms of a private dwelling excludes bathrooms, halls, vestibules and rooms used solely for business purposes. Partially divided rooms are considered to be separate rooms if they are considered as such by the respondent (e.g., L-shaped diningroom and livingroom arrangements).
Refers to the proportion of average monthly 2010 total household income which is spent on owner's major payments (in the case of owner-occupied dwellings) or on gross rent (in the case of tenant-occupied dwellings).
Percentage of a household's average total monthly income which is spent on shelter-related expenses. Those expenses include the monthly rent (for tenants) or the mortgage payment, property taxes and condominium fees (for owners) and the costs of electricity, heat, municipal services, etc. The percentage is calculated by dividing the total shelter-related expenses by the household's total monthly income and multiplying the result by 100.
Reported in: 2011
Reported for: Private households in owner- or tenant-occupied non-farm dwellings
Question no.: Derived variable: Questions 55, E8(a), (b), (c), E9(a), E10(a), (c) and (e)
Responses: In the standard products, the most detailed classification is as follows:
Less than 30%50% to less than 100%
Less than 15%
15% to less than 30%
30% or more
30% to less than 50%
50% or more
50% to less than 100%
Remarks: This concept is illustrated below:
(a) Owner-occupied non-farm dwellings:
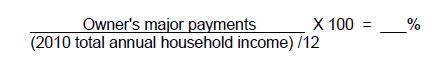
(b) Tenant-occupied non-farm dwellings:
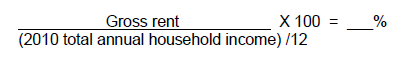
Excludes households who reported a loss in their total household income, or had no income in 2010. The category 'Less than 15%' includes households with income who incurred no owner's major payments/gross rent.
See 'Remarks' under the definitions Owner's major payments and Rent, gross.
Reported for: Private households in owner- or tenant-occupied non-farm dwellings
Question no.: Derived variable: Questions 55, E8(a), (b), (c), E9(a), E10(a), (c) and (e)
Responses: In the standard products, the most detailed classification is as follows:
Less than 30%50% to less than 100%
Less than 15%
15% to less than 30%
30% or more
30% to less than 50%
50% or more
50% to less than 100%
Remarks: This concept is illustrated below:
(a) Owner-occupied non-farm dwellings:
(b) Tenant-occupied non-farm dwellings:
Excludes households who reported a loss in their total household income, or had no income in 2010. The category 'Less than 15%' includes households with income who incurred no owner's major payments/gross rent.
See 'Remarks' under the definitions Owner's major payments and Rent, gross.
Refers to whether the dwelling is subsidized.
Subsidized housing includes rent geared to income, social housing, public housing, government-assisted housing, non-profit housing, rent supplements and housing allowances.
Subsidized housing includes rent geared to income, social housing, public housing, government-assisted housing, non-profit housing, rent supplements and housing allowances.
Refers to whether the household owns or rents their private dwelling, or whether the dwelling is band housing (on an Indian reserve or settlement).
Reported in: 2011
Reported for: Private households
Question no.: Direct variable: Question E2
Responses: Owned; Rented
Remarks: The private dwelling may be situated on rented or leased land or be part of a condominium development. A household is considered to own their dwelling if some member of the household owns the dwelling even if it is not fully paid for, for example if there is a mortgage or some other claim on it. A household is considered to rent their dwelling if no member of the household owns the dwelling. A household is considered to rent that dwelling even if the dwelling is provided without cash rent or at a reduced rent, or if the dwelling is part of a cooperative.
For historical and statutory reasons, shelter occupancy on reserves does not lend itself to the usual classification by standard tenure categories. Therefore, a special category, band housing, has been created.
Refers to the dollar amount expected by the owner if the dwelling were to be sold.
Reported in: 2011
Reported for: Owner-occupied non-farm dwellings
Question no.: Direct variable: Question E10(d)
Responses: Dollar value
Remarks: 'Value of dwelling' refers to the value of the entire dwelling, including the value of the land it is on and of any other structure, such as a garage, which is on the property. If the dwelling is located in a building which contains several dwellings, or a combination of residential and business premises, all of which the household owns, the value is estimated as a portion of the market value that applies only to the dwelling in which the household resides.

