


| Documentation: | Census 1960 Tracts Only Set |
you are here:
choose a survey
survey
document
chapter
Publisher: U.S. Census Bureau
Survey: Census 1960 Tracts Only Set
| Document: | Mother Tongue of the Foreign Born (Volume II, Part I - Subject Reports) |
| citation: | U.S. Bureau of the Census. U.S. Census of Population: 1960. Subject Reports, Mother Tongue of the Foreign Borne. Final Report PC(2)-1E. U.S. Government Printing Office, Washington, D.C. 1966. |
Chapter Contents
Some of the definitions used in 1960 differ from those used in 1950. These changes were made after consultation with users of census data in order to improve the statistics, even though it was recognized that comparability would be affected. The definitions and explanations should be interpreted in the context of the 1960 Censuses, in which data were collected by a combination of self-enumeration, direct interview, and observation, by the enumerator.
The definitions below are consistent with the instructions given to the enumerator. As in all surveys, there were some failures to execute the instructions exactly. Through the forms distributed to households, the respondents were given explanations of some of the questions more uniformly than would have been given in direct interviews. Nevertheless, it was not feasible to give the full instructions to the respondents, and some erroneous replies have undoubtedly gone undetected.
More complete discussions of the definitions of population items are given in 1960 Census of Population, Volume I, Characteristics of the Population, Part 1, United States Summary, and in each of the State parts.
The data on mother tongue shown in this report were derived from answers to the following question on the Household Questionnaire:

In the 1960 Census, mother tongue is defined as the principal language spoken in the person's home before he came to the United States. If a person reported more than one language, he was assigned the code for the one which in the 1940 Census was most frequently reported by Immigrants from his native country.
The categories of mother tongue shown in this report are arranged in geographic order, which in general parallels that of the usual classification by country of origin.
Data on mother tongue, cross-classified by age and education, are presented for the most common European languages, as well as Chinese, Japanese, and Arabic. Because of interest in the number of persons reporting the rarer languages, this report includes a table presenting a detailed inventory of languages reported. Although data on mother tongue do not necessarily reflect a person's current language skill, such data may provide some rough measure of latent language resources.
For the United States approximately 7 percent of the foreign-born population did not report mother tongue. Failure to report a language may have resulted from a number of causes. For example, in some situations, the respondent and the enumerator may have thought the mother tongue was obvious from the country of birth. Furthermore, since the mother-tongue question was asked only of foreign-born persons, It was asked relatively rarely in some areas and may have been overlooked by the enumerator. It is apparent that in areas where there are large concentrations of foreign-born persons, nonresponse rates are substantially lower than in areas where there are relatively few such persons.
The statistics on mother tongue in this report differ from those published in Volume I because of a different procedure used for the tabulation of non- responses for mother tongue. In Volume I, all non- responses were shown as a separate category. In this report, allocations of mother tongue were made for some nonresponses on the basis of the country of birth of the individual. The basic procedure involved the use of data from the 1940 and 1930 censuses which showed that in 12 countries; over 90 percent of the foreign-born population had reported the same mother tongue. For 1960, nonresponses on mother tongue for persons born in these 12 countries were allocated to the major language of the country. This procedure accounted for the allocation of almost half of all the nonresponses, leaving 3.9 percent of the foreign-born population in the category "mother tongue not reported." (See table A and appendix table A-1.)
Table A. Allocations for Nonresponse by Mother Tongue: 1960
In 1940, no attempt was made to allocate mother tongue for those persons not reporting; in preceding censuses, persons not reporting mother tongue were allocated to a specific mother tongue if the persons originated in a country from which immigrants had reported, in the main, a single mother tongue.
The statistics on mother tongue in this report differ from those published in Volume I because of a different procedure used for the tabulation of non- responses for mother tongue. In Volume I, all non- responses were shown as a separate category. In this report, allocations of mother tongue were made for some nonresponses on the basis of the country of birth of the individual. The basic procedure involved the use of data from the 1940 and 1930 censuses which showed that in 12 countries; over 90 percent of the foreign-born population had reported the same mother tongue. For 1960, nonresponses on mother tongue for persons born in these 12 countries were allocated to the major language of the country. This procedure accounted for the allocation of almost half of all the nonresponses, leaving 3.9 percent of the foreign-born population in the category "mother tongue not reported." (See table A and appendix table A-1.)
Table A. Allocations for Nonresponse by Mother Tongue: 1960
| Mother tongue | Total after allocation | Allocations | |
| Number | Percent of total | ||
| Total foreign born | 9,738,155 | 330,894 | 3.4 |
| English | 1,979,949 | 126,947 | 6.4 |
| Norwegian | 152,687 | 11,913 | 7.8 |
| Swedish | 225,607 | 14,010 | 6.2 |
| Danish | 85,421 | 5,802 | 6.8 |
| Dutch | 130,482 | 6,869 | 5.3 |
| Spanish | 815,009 | 48,044 | 5.9 |
| German | 1,332,399 | 53,632 | 4.0 |
| Greek | 180,781 | 7,750 | 4.3 |
| Italian | 1,277,585 | 51,444 | 4.0 |
| Portuguese | 91,592 | 4,483 | 4.9 |
| Other | 3,088,667 | … | … |
| Not reported | 377,976 | … | … |
In 1940, no attempt was made to allocate mother tongue for those persons not reporting; in preceding censuses, persons not reporting mother tongue were allocated to a specific mother tongue if the persons originated in a country from which immigrants had reported, in the main, a single mother tongue.
A question on mother tongue was asked in the Censuses of 1910, 1920, 1930, and 1940. The comparability of these data is limited to some extent by changes in the wording of the question, in the categories of the population to which the question was addressed, and in the detail that was published. In 1940, the question asked for the language spoken in earliest childhood, with a caution to enumerators that when obtaining this Information from foreign-born persons, they should record the language spoken in the home before the person came to the United States. In 1960, if both English and another mother tongue were reported, preference was always given to the non-English language. This procedure may reduce somewhat the proportion of the foreign-born population classified as having English as their mother tongue.
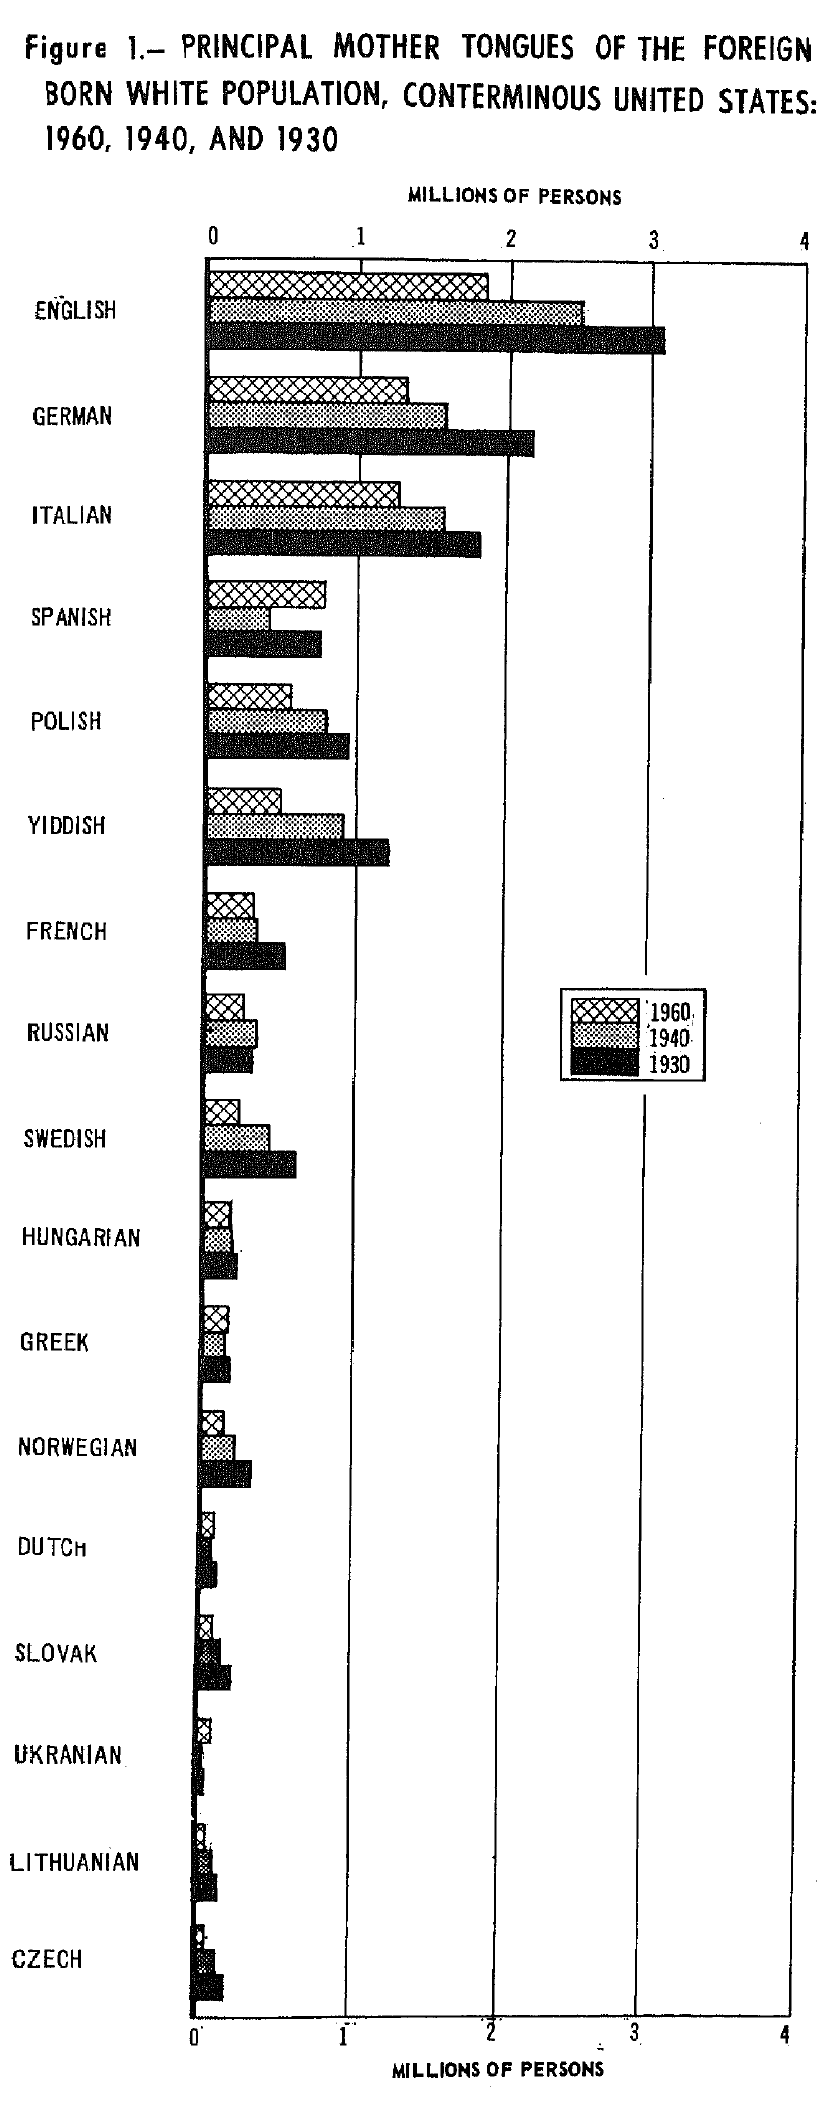
In the 1910 and 1920 Censuses, statistics on mother tongue were published for the foreign white stock; in 1930, they were published for the foreign- born white population; and in 19^0 they were published for the native white of native parentage as well as the foreign white stock. For this report they are shown for the foreign-born population of all races combined and, for historical comparability, for the foreign-born white population also. (See figure 1.)
Figure 1. Principal Mother Tongues of the Foreign Born White Population, Conterminous United States: 1960, 1940, And 1930
Foreign-born persons were asked to report their country of birth according to international boundaries as recognized by the United States on April 1, 1960. Similarly, in the editing and coding of data on country of birth of the foreign born, the list of countries used, was composed of those officially recognized by the United States at the time of the census. In these operations, replies to the question on mother tongue were used for the determination of the national origin of the foreign born, especially of those persons born in certain Eastern European areas which have experienced many changes in national sovereignty.
The median is presented in connection with the data on age and years of school completed. It is the value which divides the distribution into two equal parts, one-half the cases falling below this value and one-half the oases exceeding this value.
For 1960, the term "United States" when used without qualifications refers to the States and the District of Columbia. To preserve historical comparability, some 1960 totals are shown for the 48 States and the District of Columbia, excluding Alaska and Hawaii. This area is designated "conterminous United States.
Except in New England, a standard metropolitan statistical area (SMSA) is a county or group of contiguous counties which contains at least one city of 50,000 inhabitants or more, or "twin cities" with a combined population of at least 50,000. In addition to the county, or counties, containing such a city or cities, contiguous counties are included in an SMSA if, according to certain criteria, they are essentially metropolitan in character and are socially and economically integrated with the central city. In New England, SMSA's consist of towns and cities, rather than counties. Data in this report are shown for SMSA's of 250,000 or more with 25,000 or more foreign- born persons. (See table B.)
Table B. Percent of the Foreign Born Of Each Mother Tongue Living in Selected Standard Metropolitan Statistical Areas: 1960
(Standard metropolitan statistical areas of 250,000 or more with 25,000 or more foreign-torn persons)
Table B. Percent of the Foreign Born Of Each Mother Tongue Living in Selected Standard Metropolitan Statistical Areas: 1960
(Standard metropolitan statistical areas of 250,000 or more with 25,000 or more foreign-torn persons)
| Mother tongue | Total | In selected metropolitan statistical areas | |
| Number | Percent | ||
| Total | 9,738,155 | 6,955,323 | 71.4 |
| English | 1,979,949 | 1,424,446 | 72.0 |
| Norwegian | 152,687 | 86,210 | 56.5 |
| Swedish | 225,607 | 135,359 | 60.0 |
| Danish | 85,421 | 44,721 | 52.4 |
| Dutch | 130,482 | 70,946 | 54.4 |
| French | 330,220 | 188,175 | 57.0 |
| German | 1,332,399 | 911,722 | 68.4 |
| Polish | 581,936 | 447,033 | 76.8 |
| Czech | 91,711 | 62,496 | 68.1 |
| Slovak | 125,000 | 84,107 | 67.3 |
| Hungarian (Magyar) | 213,118 | 161,866 | 76.0 |
| Serbo-Croatian | 88,094 | 66,649 | 75.7 |
| Slovenian | 32,108 | 21,730 | 67.7 |
| Russian | 276,834 | 229,423 | 82.9 |
| Ukranian | 106,974 | 86,676 | 81.0 |
| Lithuanian | 99,043 | 71,528 | 72.2 |
| Finnish | 53,168 | 23,582 | 44.4 |
| Rumanian | 38,019 | 31,747 | 83.5 |
| Yiddish | 503,605 | 468,815 | 93.1 |
| Greek | 180,781 | 129,573 | 71.7 |
| Italian | 1,277,585 | 1,010,046 | 79.1 |
| Spanish | 815,009 | 530,775 | 65.1 |
| Portuguese | 91,592 | 47,406 | 51.8 |
| Japanese | 95,027 | 64,137 | 67.5 |
| Chinese | 89,609 | 75,295 | 84.0 |
| Arabic | 49,908 | 31,870 | 63.9 |
| All other | 314,293 | 223,342 | 71.8 |
| Not reported | 377,976 | 222,648 | 58.9 |
The age classification is based on the age of the person in completed years as of April 1, 1960, as determined from the reply to a question on month and year of birth.
The term "color" refers to the division of population into two groups, white and nonwhite. The color group designated as "nonwhite" consists of such races as the Negro, American Indian, Japanese, Chinese, Filipino, Korean, Asian Indian, and Malayan races. Persons of Mexican birth or ancestry who are not definitely of Indian or other nonwhite race are classified as white.
The data on years of school completed were derived from the answers to the two questions: (a) "What is the highest grade (or year) of regular school he has ever attended?" and (b) "Did he finish this grade (or year)?" Enumerators were instructed to obtain the approximate equivalent grade in the American school system for persons whose highest grade of attendance was in a foreign school system, whose highest level of attendance was in an ungraded school, whose highest level of schooling was measured by "readers," or whose training by a tutor was regarded as qualifying under the "regular" school definition. Persons were to answer "No" to the second question if they were attending school, had completed only part of a grade before they dropped out, or failed to pass the last grade attended.
The number in each category of highest grade of school completed represents the combination of (a) persons who reported that they had attended the indicated grade and finished it, and (b) those who had attended the next higher grade but had not finished it.
The questions on educational attainment applied only to progress in "regular" schools. Regular schooling is that which may advance a person toward an elementary school certificate or high school diploma, or a college, university, or professional degree. Schooling that was not obtained in a regular school and schooling from a tutor or through correspondence courses were counted only if the credits obtained were regarded as transferable to a school In the regular school system. Schooling which is generally regarded as not regular includes that which is given in nursery schools, in specialized vocational, trade, or business schools; in on-the-job training; and through correspondence courses.
Elementary school, as defined here, includes grades 1 to 8, and high school includes grades 9 to 12.Collegeincludes junior or community colleges, regular 4-year colleges, and graduate or professional schools. The category "less than 5 years" includes persons reporting "none" for years of school completed.

