


| Documentation: | Census 1960 (US, County & State) |
you are here:
choose a survey
survey
document
chapter
Publisher: U.S. Census Bureau
Survey: Census 1960 (US, County & State)
| Document: | Employment Status and Work Experience(Volume II, Part VI - Subject Reports) |
| citation: | U.S. Bureau of the Census. U.S. Census of Population: 1960. Subject Reports, Employment Status and Work Experience. Final Report PC(2)-6A. U.S. Government Printing Office, Washington, D.C. 1963. |
Chapter Contents
Employment Status and Work Experience(Volume II, Part VI - Subject Reports)
Some of the definitions used in 1960 differ from those used in 1950. These changes were made after consultation with users of census data in order to improve the statistics, even though it was recognized that comparability would be affected. The definitions and explanations should be interpreted in the context of the 1960 Censuses, in which data were collected by a combination of self-enumeration, direct interview, and observation by the enumerator.
The definitions below are consistent with the instructions given to the enumerator. As in all surveys, there were some failures to execute the instructions exactly. Through the forms distributed to households, the respondents were given explanations of some of the questions more uniformly than would have been given in direct interviews. Nevertheless, it was not feasible to give the full instructions to the respondents, and some erroneous replies have undoubtedly gone undetected.
More complete discussions of the definitions of population items are given in 1960 Census of Population, Volume I, Characteristics of the Population, Part 1, United States Summary, and in each of the State parts.
The data on employment status were derived from answers to the following questions on the Household Questionnaire, shown in the next column.
The series of questions " on employment status are designed to identify, in this sequence: (a) Persons who worked at all during the reference week; (b) those who did not work but were looking for work or were on layoff; and (c) those who neither worked nor looked for work but had jobs or businesses from which they were temporarily absent. For those who worked during the reference week, a question was asked on hours of work.
The series of questions " on employment status are designed to identify, in this sequence: (a) Persons who worked at all during the reference week; (b) those who did not work but were looking for work or were on layoff; and (c) those who neither worked nor looked for work but had jobs or businesses from which they were temporarily absent. For those who worked during the reference week, a question was asked on hours of work.
In the 1960 Census, the data on employment refer to the calendar week prior to the date on which the respondents filled their Household Questionnaires or were interviewed by enumerators. This week is not the same for all respondents because not all persons were enumerated during the same week. The majority of the population was enumerated during the first half of April. The employment status data for the 1950 Census refer to the approximately corresponding period in 1950. The 1940 Census data, however, refer to a fixed week, March24 to 30, 1940, regardless of the date of enumeration.

Employed persons comprise all civilians14 years old and over who were either (a) "at work"- those who did any work for pay or profit, or worked without pay for 15 hours or more on a family farm or in a family business; or (b) were "with a job but not ft work"-those who did not work and were not looking for work but had a job or business from which they were temporarily absent because of bad weather, industrial dispute, vacation, illness, or other personal reasons. There appears to have been a tendency for seasonal workers, particularly nonwhite women in the rural South, to report themselves as "with a job but not at work" during the off-season.
Persons are classified as unemployed if they were civilians years old and over and not "at work" but looking for work.. A person is considered as looking for work not only if he actually tried to find work during the reference week but also if he had made such efforts recently (i.e., within the past 60 days) and was awaiting the results of these efforts. Examples of looking for work are:
1.Registration at a public or private employment office.
2.Meeting with or telephoning prospective employers.
3.Being on call at a personnel office, at a union hall, or from a nurses' register or other similar professional register.
4.Placing or answering advertisements.
5.Writing letters of application.
Persons waiting to "be called back to a job from which they had been laid off or furloughed were also counted as unemployed.
The labor force Includes all persons classified as employed or unemployed, as described above, and also members of the Armed Forces (persons on active duty with the U.S. Army, Air Force, Navy, Marine Corps, or Coast Guard). The "civilian labor force" comprises only the employed and unemployed components of the labor force.
This category "consists of all persons l4 years old and over who are not classified as members of the labor force and Includes persons doing only incidental unpaid work in a family farm or business (less than. 15 hours during the week). Most of the persons in this category are students, housewives, retired workers, seasonal workers enumerated in an "off" season who were not looking for work, inmates of institutions, or persons who cannot work because of long-term physical or mental Illness or disability.
Although the classification of the population by employment status is correct for most regular full-time workers, it is subject to error in marginal cases. Some of the concepts are difficult to apply; more important, for certain groups, the complete information needed is not always obtained. For example, students or housewives may not consider themselves as working if their job required only a few hours of work a week. As a result, the statistics will understate the size of the labor force and overstate the number of persons not in the labor force. (See paragraph below on Current Population Survey and also section "Quality of data on employment status and work experience.")
The data on the labor force for 1940, 1950, and 1960 are not entirely comparable with the statistics for gainful workers for years prior to 1940 because of differences in definition. "Gainful workers" were persons reported as having a gainful occupation, that is, an occupation in which they earned money or a money equivalent, or in which they assisted in the production of marketable goods, regardless of whether they were working or seeking work at the time of the census. A person was not considered to have had a gainful occupation if his activity was of limited extent.
In contrast, the labor force is defined on the basis of activity during the reference week- only and includes all persons who were employed, unemployed, or in the Armed Forces during the week. Certain classes of persons, such as retired workers, and seasonal workers neither working nor seeking work at the time of the census, were frequently included among gainful workers; but in general, such persons are not included in the labor force. On the other hand, the census included in the labor force for 1940, 1950, and 1960 persons without previous work experience who were seeking work, that is, new workers. Such new workers were not reported as gainful workers in the Censuses of 1920 and 1930.
In contrast, the labor force is defined on the basis of activity during the reference week- only and includes all persons who were employed, unemployed, or in the Armed Forces during the week. Certain classes of persons, such as retired workers, and seasonal workers neither working nor seeking work at the time of the census, were frequently included among gainful workers; but in general, such persons are not included in the labor force. On the other hand, the census included in the labor force for 1940, 1950, and 1960 persons without previous work experience who were seeking work, that is, new workers. Such new workers were not reported as gainful workers in the Censuses of 1920 and 1930.
The 1940 and 1950 Census questionnaires, interviewing techniques, and tabulation procedures differed somewhat from each other and from those used in the 1960 Census. These changes may have affected comparability; for example, a person may have reported on his own job activities differently in self-enumeration wherein a person was given the opportunity to report for himself, as contrasted to the direct enumeration procedures used in earlier censuses, where job information was normally obtained in an interview with a member of the worker's family (usually his wife). In addition, modification in wording and some simplification in concepts were introduced in the 1960 Census, instead of using the Current Population Survey questions and concepts almost unchanged as was done in the 1950 Census. These changes were made in recognition of the different tasks and training of the enumerators in the CPS and the Census.
The so-called "main activity" question of 1950 "What was this person doing most of last week - working, keeping house, or something else?"-was omitted from the 1960 schedule on the assumption that the information obtained in that item (e.g., the knowledge that a person was primarily a housewife or a student) might induce enumerators, in direct interview situations, to omit the follow-up questions on work activity, job seeking, etc. It was felt that the loss of the classification of nonworkers (keeping house, in school, unable to work, and "other") shown in 1950 would not be serious. Actually the only group that cannot be approximated by means of data on marital status and school enrollment is the "unable to work" category.
The question on unemployment was revised in conformity with the classification under the 1957 CPS revision of the definition of persons on temporary (less than 30-day) layoff as unemployed, as well as with the previous implicit inclusion with the unemployed of those on "indefinite" layoff. Formerly, such persons were included among the employed. However, no mention was made either on the schedule or in instructions to enumerators of the other small categories of "inactive" unemployed covered under CPS concepts and in the 1950 and 1940 Censuses, that is, those who would have been looking for work except for temporary illness or belief that no suitable work was available in their community. The definition of "unpaid family work" was simplified to include any work done without pay in an enterprise operated by a relative, without further specifying (as in CPS and in the 1950 Census) that this relative had to be a member of the same household. In 19^0, this relative had to be a member of the same family.
The 1940 Census data for the employed and unemployed in this report, differ in some cases from figures published for that census. Members of the Armed Forces in 1940 were originally included among employed persons. In this report, the figures for 19^0 on employed persons have been adjusted to exclude the estimated number of men in the Armed Forces. Similarly, statistics for persons on public emergency work in 1940 were originally published separately, but in this report they have been combined with those for persons classified as unemployed.
There are differences between the national data from the Population Census and the CPS that are due to a number of factors. Among these are the more extensive training, control, and experience of the CPS enumerators than of the census enumerators; differences in the time period to which the labor force data apply (the CPS covering the week containing the 12th of the month; the census, the week prior to the date the respondent filled his questionnaire or was interviewed); differences in question wording and format of the schedules; differences in coverage (the CPS including in the total labor force members of the Armed Forces overseas, excluding inmates of institutions from the population covered, and excluding members of the Armed Forces from the annual work experience data) ; enumeration of unmarried college students in the CPS at their parental home but in the census at their residence while attending college; differences in the methods used to process the original data into statistical tables; differences in weighting procedure and in the population controls; differences in the extent and allocation of noninterview cases;-and in the sampling variability in the CPS and in the 5-percent sample used in this report.
Table A presents a comparison of data on employment status as shown by the 25-percent sample and the April 1960 CPS. The size of the civilian labor force, as measured in the census, was 1.7 million, or 2 percent, below the corresponding CPS figure. Most of this deficit occurred among persons employed in agriculture, where the census figure was 1.1 million, or 21 percent, below the CPS figure. Differences in labor force data from the two sources were relatively greater for females than males and 'also greater for youths (14 to 24 years old) than for other age groups. (For further discussion of differences between the two sources, see "Quality of data.")
Differences between employment status data from the decennial census and the CPS in 1960 were less than those in 1950, as is shown in table A. The size of the civilian labor force in the census in 1960 was 2 percent below the CPS figure as compared to 5 percent below in 1950. Closer agreement in employment status data was noted in most groups by age, color, and sex. The narrowing of the difference presumably resulted from the combined effects of changes in enumeration procedures and in questionnaire design for the 1960 Census.
Because the 1960 Census employment data were obtained from respondents in households, they differ from statistics based on reports from individual business establishments, farm enterprises, and certain government programs. The data obtained from households provide information about the work status of the whole population without duplication. Persons employed at more than one job are counted only once in the census. In statistics based on reports from business and farm establishments, on the other hand, persons who work for more than one establishment may be counted more than once. Moreover, other series, unlike those presented here, may exclude private household workers, unpaid family workers, and self-employed persons, but may include workers less than l4 years of age.
Table A. Comparison of Employment Status, By Sex, For the Census and April Current Population Survey: 1960 And 1950
(Civilian noninstitutional population in thousands)
NOTE. Census data excludes inmates of institutions and members of Armed Forces for purposes of direct comparability with CPS.
An additional difference between the two kinds of data arises from the fact that persons who had a job but were not at work are included with the employed in the statistics shown here, whereas many of the persons are likely to be excluded from employment figures based on establishment payroll reports. Furthermore, the household reports include persons on the basis of their place of residence regardless of where they work, whereas establishment data report persons at their place of work regardless of where they live.
For a number of reasons, the unemployment figures of the Bureau of the Census are not comparable with published figures on unemployment compensation claims. Generally, persons such as private household workers, agricultural workers, State and local government workers, the self-employed, new workers, and workers whose rights to unemployment benefits have expired, are not eligible for unemployment compensation. Further, many employees of small firms are not covered by unemployment insurance. In addition, the qualifications for drawing unemployment compensation differ from the definition of unemployment used by the Bureau of the Census. Persons working only a few hours during the week and persons classified as "with a job but not at work" are sometimes eligible for unemployment compensation but are classified as "employed" in the census reports.
Table A. Comparison of Employment Status, By Sex, For the Census and April Current Population Survey: 1960 And 1950
(Civilian noninstitutional population in thousands)
| Employment status and sex | 1960 | 1950 | ||||||||||
| Census (25-percent sample) | April CPS | Difference of census from CPS | Difference as percent of CPS | Census (25-percent sample) | April CPS | Difference of census from CPS | Difference as percent of CPS | |||||
| Number | Percent | Number | Percent | Number | Percent | Number | Percent | |||||
| Both sexes | ||||||||||||
| Total, 14 years and over | 122,783 | 100.0 | 122,406 | 100.0 | +377 | +0.3 | 109,928 | 100.0 | 109,207 | 100.0 | +721 | +0.7 |
| Labor force | 68,144 | 55.5 | 69,819 | 57.0 | -,1675 | -1.4 | 59,072 | 53.7 | 62,183 | 56.9 | -3,111 | -5.0 |
| Employed | 64,639 | 94.9 | 66,159 | 94.8 | -1,520 | -2.3 | 56,239 | 95.2 | 58,669 | 94.3 | -2,429 | -4.1 |
| Agriculture | 4,256 | 6.6 | 5,393 | 8.2 | -1,137 | -21.1 | 6,876 | 12.2 | 7,195 | 12.3 | -319 | -4.4 |
| Nonagriculture | 60,383 | 93.4 | 60,766 | 91.8 | -383 | -0.6 | 49,363 | 87.8 | 51,473 | 87.7 | -2,110 | -4.1 |
| Uneployed | 3,505 | 5.1 | 3,660 | 5.2 | -155 | -4.2 | 2,832 | 4.8 | 3,515 | 5.7 | -683 | -19.4 |
| Not in labor force | 54,639 | 44.5 | 52,587 | 43.0 | +2,052 | +3.9 | 50,856 | 46.3 | 47,024 | 43.1 | +3,832 | +8.1 |
| Male | ||||||||||||
| Total, 14 years and over | 58,570 | 100.0 | 58,310 | 100.0 | +260 | +0.4 | 53,478 | 100.0 | 52,971 | 100.0 | +507 | +1.0 |
| Labor force | 45,763 | 78.1 | 46,580 | 79.9 | -817 | -1.8 | 42,599 | 79.7 | 44,120 | 83.3 | -1,521 | -3.4 |
| Employed | 43,467 | 95.0 | 44,149 | 94.8 | -682 | -1.5 | 40,519 | 95.1 | 41,492 | 94.0 | -973 | -2.3 |
| Agriculture | 3,846 | 8.8 | 4,575 | 10.4 | -729 | -15.9 | 6,292 | 15.5 | 6,272 | 15.1 | +20 | +0.3 |
| Nonagriculture | 39,621 | 91.2 | 39,574 | 89.6 | +47 | +0.1 | 34,227 | 84.5 | 35,220 | 84.9 | -993 | -2.8 |
| Uneployed | 2,296 | 5.0 | 2,431 | 5.2 | -135 | -5.6 | 2,079 | 4.9 | 2,628 | 6.0 | -549 | -20.9 |
| Not in labor force | 12,807 | 21.9 | 11,730 | 20.1 | +1,077 | +9.2 | 10,879 | 20.3 | 8,851 | 16.7 | +2,028 | +22.9 |
| Female | ||||||||||||
| Total, 14 years and over | 54,213 | 100.0 | 64,096 | 100.0 | +117 | +0.2 | 56,450 | 100.0 | 56,236 | 100.0 | +214 | +0.4 |
| Labor force | 22,381 | 34.9 | 23,239 | 36.3 | +858 | -3.7 | 16,473 | 29.2 | 18,063 | 32.1 | -1,590 | -8.8 |
| Employed | 21,172 | 94.6 | 22,010 | 94.7 | -838 | -3.8 | 15,720 | 95.4 | 17,176 | 95.1 | -1,456 | -8.5 |
| Agriculture | 410 | 1.9 | 819 | 3.7 | -409 | -49.9 | 584 | 3.7 | 923 | 5.4 | -339 | -36.7 |
| Nonagriculture | 20,762 | 98.1 | 21,191 | 96.3 | -429 | -2.0 | 15,136 | 96.3 | 16,253 | 94.6 | -1,117 | -6.9 |
| Uneployed | 1,209 | 5.4 | 1,229 | 5.3 | -20 | -1.6 | 753 | 4.6 | 887 | 4.9 | -134 | -15.1 |
| Not in labor force | 41,832 | 65.1 | 40,857 | 63.7 | +975 | +2.4 | 39,977 | 70.8 | 38,173 | 67.9 | +1,804 | +4.7 |
NOTE. Census data excludes inmates of institutions and members of Armed Forces for purposes of direct comparability with CPS.
An additional difference between the two kinds of data arises from the fact that persons who had a job but were not at work are included with the employed in the statistics shown here, whereas many of the persons are likely to be excluded from employment figures based on establishment payroll reports. Furthermore, the household reports include persons on the basis of their place of residence regardless of where they work, whereas establishment data report persons at their place of work regardless of where they live.
For a number of reasons, the unemployment figures of the Bureau of the Census are not comparable with published figures on unemployment compensation claims. Generally, persons such as private household workers, agricultural workers, State and local government workers, the self-employed, new workers, and workers whose rights to unemployment benefits have expired, are not eligible for unemployment compensation. Further, many employees of small firms are not covered by unemployment insurance. In addition, the qualifications for drawing unemployment compensation differ from the definition of unemployment used by the Bureau of the Census. Persons working only a few hours during the week and persons classified as "with a job but not at work" are sometimes eligible for unemployment compensation but are classified as "employed" in the census reports.
The statistics on hours worked pertain to the number of hours actually worked, and not necessarily to the number usually worked or the scheduled number of hours. For persons working at more than one job, the figures reflect the combined number of hours worked at all jobs during the week. The data on hours worked presented here provide a broad classification of persons at work into full-time and part-time workers. Persons are considered to be working full time if they worked 35 hours or more during the reference week and part time if they worked less than 35 hours. The proportion of persons who worked only a small number of hours is probably understated because such persons were omitted from the labor force count more frequently than were full-time workers. The comparability of data for 1960 and 1950 on hours worked may be affected by the fact that in 1950 a precise answer on number of hours was requested, whereas in 1960 check boxes were provided as shown in item P23.
The data on weeks worked in 1959 were derived from answers to the following two questions on the Household Questionnaire:

The data pertain to the number of different weeks during 1959 in which a person did any work for pay or profit (including paid vacation and sick leave) or worked without pay on a family farm or in a family business. Weeks of active service in the Armed Forces are also included. It is probable that the number of persons who worked in 1959 and the number of weeks they worked are understated, because there is some tendency for respondents to forget intermittent or short periods of employment, or they may have a tendency not to report weeks worked without pay.
The data pertain to the number of different weeks during 1959 in which a person did any work for pay or profit (including paid vacation and sick leave) or worked without pay on a family farm or in a family business. Weeks of active service in the Armed Forces are also included. It is probable that the number of persons who worked in 1959 and the number of weeks they worked are understated, because there is some tendency for respondents to forget intermittent or short periods of employment, or they may have a tendency not to report weeks worked without pay.
The comparability of data on weeks worked collected in the 1940 and 1950 Censuses with data collected in the 1960 Census may be affected by certain changes in the questionnaires. In the 1960 questionnaire, two separate questions were used to obtain this information. The first was used to identify persons with any work experience in 1959 and thus to indicate those for whom the questions on number of weeks worked and earned income were applicable. This procedure differs from that used in 1940 and 1950, when the schedules contained a single question regarding the number of weeks worked.
In 1940, the enumerator was instructed to convert part-time work to equivalent full-time weeks, whereas in 1950 and 1960 no distinction was made between a part-time and full-time work week. The 1940 procedure was to define as a full-time week the number of hours locally regarded as full time for the given occupation and industry. Furthermore, in the 1940 Census reports, the data were shown for wage and salary workers only and were published in terms of months rather than weeks.
In 1940, the enumerator was instructed to convert part-time work to equivalent full-time weeks, whereas in 1950 and 1960 no distinction was made between a part-time and full-time work week. The 1940 procedure was to define as a full-time week the number of hours locally regarded as full time for the given occupation and industry. Furthermore, in the 1940 Census reports, the data were shown for wage and salary workers only and were published in terms of months rather than weeks.
Many of the differences between the Population Census and the CPS previously mentioned in the discussion of employment status also apply to the work experience data. Most noteworthy is the fact that the CPS data on weeks worked in 1959 exclude members of the Armed Forces whereas the census data include this group. The data from the census showed 61.3 percent of the population14 years old and over as having worked in the previous year compared to 64.0 percent in the CPS. This difference compares quite favorably with that in 1950 when the census found 4.1 percent of the population with work experience and the CPS, 62.1 percent. Table B presents data on work experience from the 1960 Census and 1960 CPS and also from the 1950 Census and 1950 CPS.
Table B. Comparison of Work Experience in Previous Year, For the Census and Current Population Survey: 1960 and 1950
(Numbers in -thousands)
1Includes inmates of institutions and members of the Armed Forces residing in the United States.
2Civilian noninstitutional population only.
3Based on a 20-percent sample,
4Work in 1949 defined as "work for pay or profit."
Table B. Comparison of Work Experience in Previous Year, For the Census and Current Population Survey: 1960 and 1950
(Numbers in -thousands)
| Work experience in previous year | 1960 | 1950 | ||||||||||
| Census1 (25-percent sample) | CPS2 | Difference of census from CPS | Difference as percent of CPS | Census1;3 | CPS2;4 | Difference of census from CPS | Difference as percent of CPS | |||||
| Number | Percent | Number | Percent | Number | Percent | Number | Percent | |||||
| Total, 14 years old and over | 126,277 | 100.0 | 122,195 | 100.0 | +4,082 | +3.3 | 111,703 | 100.0 | 108,739 | 100.0 | +2,964 | +2.7 |
| Worked in previous year | 77,368 | 61.3 | 78,162 | 64.0 | -794 | -1.0 | 60,469 | 54.1 | 67,520 | 62.1 | -7,051 | -10.4 |
| Did not work in previous year | 48,908 | 38.7 | 44,033 | 36.0 | +4,875 | +11.1 | 43,644 | 39.1 | 41,219 | 37.9 | +2,425 | +5.9 |
| Work in previous year not reported | … | … | … | … | … | … | 7,590 | 6.8 | … | … | … | … |
1Includes inmates of institutions and members of the Armed Forces residing in the United States.
2Civilian noninstitutional population only.
3Based on a 20-percent sample,
4Work in 1949 defined as "work for pay or profit."
As part of the overall 1960 Decennial Census evaluation program, a Census-Current Population Survey matching project, similar to the 1950 project, was carried out. Among other things, this study permitted an examination of labor force entries on the FOSDIC schedules (see "Collection and processing of data") in the 1960 Census and in the April 1960 CPS for identical persons and the derivation of indices of' net and gross shift, by demographic and other characteristics. The study entailed matching the CPS household to the census household and then determining whether the matched CPS household was in the census 25-percent sample for which labor force and work experience data were collected.
Employment status and work experience data were then tabulated for identical persons as reported by the census and by the CPS and weighted to national totals by the CPS two-stage ratio estimation procedure. Much of the extensive editing for nonreporting and inconsistencies in the 1960 Census was not introduced in the transcribed census match data in these tabulations.
Tables C and D present figures indicating how the CPS and census data from the matched sample correspond to comparable published percentage distributions from the full CPS and census samples. In interpreting differences between the CPS and census data, it is helpful to be aware of possible biases in the matched sample. For example, census data in the matched sample closely resemble the published census data in most categories but have a somewhat higher proportion classified as employed in agriculture.
Tables E and F present indices of gross and net shift for employment status and weeks worked in 1959 items for identical persons. The index of net shift represents the difference between the number found in a particular category in the census and the number found in the CPS expressed as a percentage of the number in the CPS category. (The CPS has been used as the standard for such measures.2) The index of net shift may be considered as an estimate of the bias of the census data according to the CPS.
Table C. Comparison of Published Labor Force Distributions for the Census and April CPS with Their Respective "Match" Study Distributions, By Sex: 1960
(Civilian noninstitutional population)
1Excludes cases with employment status not reported.
Table D. Comparison of Published Distributions of Weeks Worked In 1959 for the Census and CPS with Their Respective "Match" Study Distributions, By Sex: 1960
1Excludes cases not reporting on work experience in 1959 and weeks worked in 1959.
The index of gross shift represents the sum of the cases in a particular category in one enumeration (CPS or census) but not in the other expressed as a percentage of the total cases in that category according to the CPS. Thus, the index of gross shift covers the cases presumably improperly Included or excluded from the category according to the CPS and is a measure of the combined effect of response variability in the census and in the CPS. For comparison the table also shows similar measures for the same employment status categories from the 195*0 match study. A general factor to consider in interpreting the differences between CPS and census data is the time period of enumeration. (See section "Comparability," paragraph on Current Population Survey.) Thus, some proportion of the differences is explained by real changes in status over a period of time.
Table E. Indices of Net and Gross Shift For Matched Persons in Census-CPS "Match" Study, By Employment Status and Sex: 1960 and 1950
(Civilian noninstitutional population)
NOTE. Excludes cases with employment status not reported.
The indices of net shift show that, in general, the 1960 Census employment status data have lower net shifts or estimates of bias than those observed for 1950. This situation supports the findings stated in the section on "Comparability," which compared published census data with published CPS data. For the civilian labor force, the employed, the unemployed, and those not in the labor force, the indices of net shift in 1960 were lower than in 1950.
Most of the reductions in the indices of net shift occurred among females. In contrast to 1950, the net shifts for women in 1960 were no longer materially greater than those for men. Among the unemployed, the index of net shift fell from 18.3 percent to -6.6 percent, with substantial reductions for both males and females.
Indices of gross shift in 1960 for employment status are about as high as or higher than those in 1950 for most categories. This generalization applies to both males and females. A somewhat different conclusion, however, is reached on the basis of another index, as described below.
Table F presents indices of net and gross shift for weeks worked in 1959 for identical persons from the matched study. Largest relative differences occur in the "40 to 47 weeks" and "48 to 49 weeks" categories for both sexes. Both net and gross shifts for males were lower than those for females in most of the weeks worked categories. This differential is probably due to the predominance of part-time work among females, which results in a greater degree of response variance for this item for females than males.
Table F. Indices of Net and Gross Shift For Matched Persons in Census-CPS "Match" Study, By Weeks Worked In 1959, Color, and Sex: 1960
NOTE.-Excludes cases not reporting on work experience in 1959 and weeks worked in 1959.
Table G presents indices of net and gross shifts for the labor force by age and sex for 1960. Inconsistent reporting appears most serious for the young and old among both males and females. However, job volatility for these groups is quite high; and therefore these rates may be reflecting true changes in job status to some extent. The tenuous nature of their job attachments also makes for great difficulty in consistent reporting.
The index of gross shift shown here has been the traditional measure used in evaluation studies. It was sometimes referred to as simply the gross difference rate, but this term is not used here to avoid confusion with another measure. Recent research in this field has led to the development of an improved index. This measure is called the "index of inconsistency" and is formulated in such a way as to make these estimates of inconsistency of response more comparable from one item to another and from one time to another.
Table G. Indices of Net and Gross Shift For Matched PersonsinCensus-CPS "Match" Study, For the Civilian Labor Force, By Age, Color, and Sex: 1960
(Civilian noninstitutional population)
NOTE. Excludes cases with employment status not reported.
If the entries off the main diagonal in a 2 x 2 table, i.e., the cases in a particular category in one enumeration (CPS or census) but not in the other, are identified as d, the sum of all entries in the table as n (the universe), the proportion having the characteristic in the census as p, then the index of inconsistency can be defined as
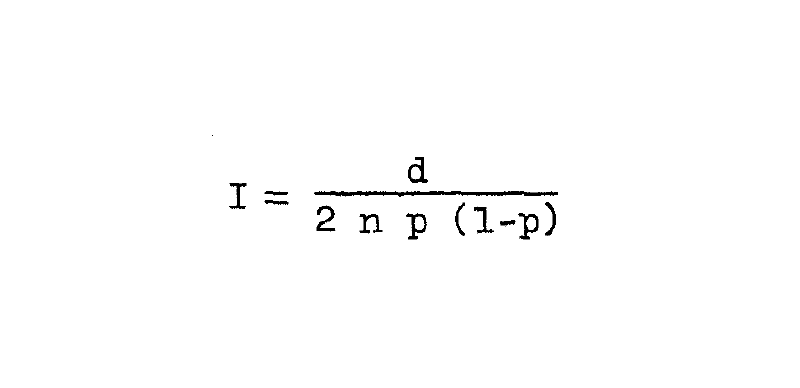
The p (1-p) in the denominator of I is taken from the census because most of the response variability arises in the census.
Illustration: Table H presents the index of inconsistency for the labor force items from the 1950 and 1960 Censuses and indicates differences in the respective indexes of inconsistency, most of which are about the same although they are slightly favorable to the 1960 Census.
Table H. Index of Inconsistency for Matched Persons in Census- CPS "Match" Study, By Employment Status and Sex: 1960 and 1950
(Minus sign (-) indicates greater unreliability in 1960 Census than, in 1950 Census; plus sign (+) indicates greater unreliability in 1950 Census)
Employment status and work experience data were then tabulated for identical persons as reported by the census and by the CPS and weighted to national totals by the CPS two-stage ratio estimation procedure. Much of the extensive editing for nonreporting and inconsistencies in the 1960 Census was not introduced in the transcribed census match data in these tabulations.
Tables C and D present figures indicating how the CPS and census data from the matched sample correspond to comparable published percentage distributions from the full CPS and census samples. In interpreting differences between the CPS and census data, it is helpful to be aware of possible biases in the matched sample. For example, census data in the matched sample closely resemble the published census data in most categories but have a somewhat higher proportion classified as employed in agriculture.
Tables E and F present indices of gross and net shift for employment status and weeks worked in 1959 items for identical persons. The index of net shift represents the difference between the number found in a particular category in the census and the number found in the CPS expressed as a percentage of the number in the CPS category. (The CPS has been used as the standard for such measures.2) The index of net shift may be considered as an estimate of the bias of the census data according to the CPS.
Table C. Comparison of Published Labor Force Distributions for the Census and April CPS with Their Respective "Match" Study Distributions, By Sex: 1960
(Civilian noninstitutional population)
| Employment status and sex | 1960 Census | April 1960 CPS | ||
| Published data (25-percent sample) | Census CPS match (matched persons1) | Published data | Census CPS match (matched persons) | |
| Both sexes | ||||
| Civilian labor force | 100.0 | 100.0 | 100.0 | 100.0 |
| Employed | 94.9 | 95.3 | 94.8 | 95.7 |
| Agriculture | 6.2 | 7.1 | 7.7 | 7.8 |
| Nonagriculture industries | 88.6 | 88.2 | 87.0 | 86.9 |
| Unemployed | 5.1 | 4.7 | 5.2 | 5.3 |
| Male | ||||
| Civilian labor force | 100.0 | 100.0 | 100.0 | 100.0 |
| Employed | 95.0 | 95.5 | 94.8 | 94.9 |
| Agriculture | 8.4 | 9.0 | 9.8 | 10.1 |
| Nonagriculture industries | 86.6 | 86.4 | 85.0 | 84.8 |
| Unemployed | 5.0 | 4.5 | 5.2 | 5.0 |
| Female | ||||
| Civilian labor force | 100.0 | 100.0 | 100.0 | 100.0 |
| Employed | 94.6 | 95.0 | 94.7 | 94.2 |
| Agriculture | 1.8 | 3.2 | 3.5 | 3.1 |
1Excludes cases with employment status not reported.
Table D. Comparison of Published Distributions of Weeks Worked In 1959 for the Census and CPS with Their Respective "Match" Study Distributions, By Sex: 1960
| Work experience and sex | 1960 Census | 1960 CPS | ||
| Published data (25-percent sample) | Census CPS match (matched persons1) | Published data | Census CPS match (matched persons) | |
| Both sexes | ||||
| Total, 14 years old and over | 100.0 | 100.0 | 100.0 | 100.0 |
| Worked in 1959 | 61.3 | 61.4 | 64.0 | 64.2 |
| Didi not work in 1959 | 38.7 | 38.6 | 36.0 | 35.8 |
| Worked in 1959 | 100.0 | 100.0 | 100.0 | 100.0 |
| 50 to 52 weeks | 56.8 | 58.0 | 60.4 | 59.8 |
| 48 to 49 weeks | 5.6 | 5.2 | 3.8 | 3.8 |
| 40 to 47 weeks | 8.9 | 9.4 | 7.7 | 7.6 |
| 27 to 39 weeks | 9.3 | 9.1 | 8.5 | 8.5 |
| 14 to 26 weeks | 8.4 | 7.6 | 8.7 | 8.6 |
| 13 weeks or less | 11.0 | 10.6 | 10.9 | 11.7 |
| Male | ||||
| Total, 14 years old and over | 100.0 | 100.0 | 100.0 | 100.0 |
| Worked in 1959 | 82.0 | 83.0 | 84.1 | 84.9 |
| Didi not work in 1959 | 18.0 | 17.0 | 15.9 | 15.1 |
| Worked in 1959 | 100.0 | 100.0 | 100.0 | 100.0 |
| 50 to 52 weeks | 64.9 | 66.6 | 68.8 | 67.9 |
| 48 to 49 weeks | 5.8 | 5.4 | 3.9 | 3.9 |
| 40 to 47 weeks | 85. | 9.0 | 7.3 | 7.3 |
| 27 to 39 weeks | 7.7 | 7.4 | 7.2 | 7.3 |
| 14 to 26 weeks | 6.0 | 5.3 | 6.1 | 6.2 |
| 13 weeks or less | 6.9 | 6.2 | 6.6 | 7.4 |
| Female | ||||
| Total, 14 years old and over | 100.0 | 100.0 | 100.0 | 100.0 |
| Worked in 1959 | 41.7 | 41.3 | 45.6 | 45.5 |
| Didi not work in 1959 | 58.3 | 58.7 | 54.4 | 54.5 |
| Worked in 1959 | 100.0 | 100.0 | 100.0 | 100.0 |
| 50 to 52 weeks | 41.8 | 41.9 | 46.2 | 46.0 |
| 48 to 49 weeks | 5.1 | 4.9 | 3.5 | 3.7 |
| 40 to 47 weeks | 9.6 | 10.2 | 8.3 | 8.1 |
| 27 to 39 weeks | 12.2 | 12.2 | 10.7 | 10.6 |
| 14 to 26 weeks | 12.8 | 11.9 | 13.1 | 12.7 |
| 13 weeks or less | 18.5 | 18.8 | 18.2 | 18.9 |
1Excludes cases not reporting on work experience in 1959 and weeks worked in 1959.
The index of gross shift represents the sum of the cases in a particular category in one enumeration (CPS or census) but not in the other expressed as a percentage of the total cases in that category according to the CPS. Thus, the index of gross shift covers the cases presumably improperly Included or excluded from the category according to the CPS and is a measure of the combined effect of response variability in the census and in the CPS. For comparison the table also shows similar measures for the same employment status categories from the 195*0 match study. A general factor to consider in interpreting the differences between CPS and census data is the time period of enumeration. (See section "Comparability," paragraph on Current Population Survey.) Thus, some proportion of the differences is explained by real changes in status over a period of time.
Table E. Indices of Net and Gross Shift For Matched Persons in Census-CPS "Match" Study, By Employment Status and Sex: 1960 and 1950
(Civilian noninstitutional population)
| Employment status and sex | Index of net shift | Index of gross shift | ||
| 1960 | 1950 | 1960 | 1950 | |
| Both sexes | ||||
| Civilian labor force | -2.6 | -3.5 | 12.8 | 12.4 |
| Employed | -2.4 | -2.7 | 13.0 | 12.9 |
| Agriculture | -12.7 | -10.7 | 45.7 | 33.9 |
| Nonagriculture industries | -1.5 | -1.5 | 12.7 | 12.7 |
| Unemployed | -6.5 | -18.3 | 105.5 | 90.8 |
| Not in labor force | +3.6 | +4.7 | 17.4 | 16.6 |
| Male | ||||
| Civilian labor force | -2.6 | -2.2 | 7.2 | 7.2 |
| Employed | -2.6 | -1.2 | 8.2 | 8.4 |
| Agriculture | -13.6 | -5.5 | 35.8 | 24.0 |
| Nonagriculture industries | -1.2 | -0.4 | 8.4 | 9.4 |
| Unemployed | -4.4 | -18.1 | 92.9 | 80.7 |
| Not in labor force | +11.8 | +11.5 | 31.2 | 37.5 |
| Female | ||||
| Civilian labor force | -2.7 | -6.8 | 24.2 | 25.6 |
| Employed | -2.2 | -6.2 | 22.8 | 24.2 |
| Agriculture | -7.3 | -46.4 | 107.7 | 101.6 |
| Nonagriculture industries | -2.0 | -3.8 | 20.8 | 20.2 |
| Unemployed | -10.3 | -18.9 | 127.3 | 120.3 |
| Not in labor force | +1.5 | +3.2 | 13.7 | 11.9 |
NOTE. Excludes cases with employment status not reported.
The indices of net shift show that, in general, the 1960 Census employment status data have lower net shifts or estimates of bias than those observed for 1950. This situation supports the findings stated in the section on "Comparability," which compared published census data with published CPS data. For the civilian labor force, the employed, the unemployed, and those not in the labor force, the indices of net shift in 1960 were lower than in 1950.
Most of the reductions in the indices of net shift occurred among females. In contrast to 1950, the net shifts for women in 1960 were no longer materially greater than those for men. Among the unemployed, the index of net shift fell from 18.3 percent to -6.6 percent, with substantial reductions for both males and females.
Indices of gross shift in 1960 for employment status are about as high as or higher than those in 1950 for most categories. This generalization applies to both males and females. A somewhat different conclusion, however, is reached on the basis of another index, as described below.
Table F presents indices of net and gross shift for weeks worked in 1959 for identical persons from the matched study. Largest relative differences occur in the "40 to 47 weeks" and "48 to 49 weeks" categories for both sexes. Both net and gross shifts for males were lower than those for females in most of the weeks worked categories. This differential is probably due to the predominance of part-time work among females, which results in a greater degree of response variance for this item for females than males.
Table F. Indices of Net and Gross Shift For Matched Persons in Census-CPS "Match" Study, By Weeks Worked In 1959, Color, and Sex: 1960
| Weeks worked in 1959 and sex | Index of net shift | Index of gross shift | ||||
| Total | White | Nonwhite | Total | White | Nonwhite | |
| Both sexes | ||||||
| Worked in 1959 | -4.4 | -3.9 | -9.7 | 12.7 | 11.8 | 21.1 |
| 50 to 52 weeks | -9.1 | -9.0 | -10.1 | 29.5 | 27.7 | 50.5 |
| 48 to 49 weeks | +2.40 | +28.1 | -9.3 | 177.6 | 180.3 | 155.6 |
| 40 to 47 weeks | +23.2 | +19.2 | +60.8 | 146.4 | 143.6 | 172.6 |
| 27 to 39 weeks | +.43 | +4.1 | +5.9 | 116.0 | 111.9 | 144.7 |
| 14 to 26 weeks | -16.4 | -13.3 | -35.1 | 102.9 | 100.4 | 118.4 |
| 13 weeks or less | -7.3 | -2.5 | -34.4 | 96.7 | 96.6 | 97.1 |
| Did not worked in 1959 | +7.9 | +6.8 | +21.2 | 22.9 | 20.8 | 46.1 |
| Male | ||||||
| Worked in 1959 | -2.2 | -1.7 | -7.5 | 6.8 | 6.2 | 13.0 |
| 50 to 52 weeks | -5.7 | -6.0 | -1.4 | 24.8 | 23.4 | 42.6 |
| 48 to 49 weeks | +32.9 | +38.4 | -16.0 | 189.8 | 194.4 | 148.7 |
| 40 to 47 weeks | +21.4 | +17.9 | +64.5 | 151.1 | 148.6 | 182.5 |
| 27 to 39 weeks | +3.4 | +1.7 | +15.4 | 116.9 | 114.7 | 132.6 |
| 14 to 26 weeks | -15.3 | -6.2 | -56.7 | 107.4 | 106.5 | 111.8 |
| 13 weeks or less | -7.3 | -0.7 | -44.3 | 106.9 | 106.8 | 107.2 |
| Did not worked in 1959 | +12.5 | +9.8 | +33.3 | 38.9 | 36.5 | 58.0 |
| Female | ||||||
| Worked in 1959 | -8.3 | -7.7 | -12.6 | 22.9 | 21.8 | 30.4 |
| 50 to 52 weeks | -17.8 | -16.9 | -25.6 | 41.6 | 39.1 | 64.7 |
| 48 to 49 weeks | +8.9 | +10.1 | 0.0 | 156.8 | 155.6 | 165.1 |
| 40 to 47 weeks | +26.1 | +21.4 | +57.5 | 139.1 | 135.5 | 162.9 |
| 27 to 39 weeks | +5.4 | +7.0 | -5.9 | 114.9 | 108.5 | 159.7 |
| 14 to 26 weeks | -17.3 | -18.5 | -6.8 | 99.3 | 95.9 | 127.1 |
| 13 weeks or less | -7.2 | -3.6 | -28.3 | 90.5 | 90.5 | 90.9 |
| Did not worked in 1959 | +6.8 | +6.0 | +16.7 | 18.9 | 17.1 | 41.6 |
NOTE.-Excludes cases not reporting on work experience in 1959 and weeks worked in 1959.
Table G presents indices of net and gross shifts for the labor force by age and sex for 1960. Inconsistent reporting appears most serious for the young and old among both males and females. However, job volatility for these groups is quite high; and therefore these rates may be reflecting true changes in job status to some extent. The tenuous nature of their job attachments also makes for great difficulty in consistent reporting.
The index of gross shift shown here has been the traditional measure used in evaluation studies. It was sometimes referred to as simply the gross difference rate, but this term is not used here to avoid confusion with another measure. Recent research in this field has led to the development of an improved index. This measure is called the "index of inconsistency" and is formulated in such a way as to make these estimates of inconsistency of response more comparable from one item to another and from one time to another.
Table G. Indices of Net and Gross Shift For Matched PersonsinCensus-CPS "Match" Study, For the Civilian Labor Force, By Age, Color, and Sex: 1960
(Civilian noninstitutional population)
| Age and sex | Index of net shift | Index of gross shift | ||||
| Total | White | Nonwhite | Total | White | Nonwhite | |
| Total, 14 and over | -2.7 | -2.2 | -7.2 | 12.9 | 11.8 | 22.3 |
| 14 to 17 years | -14.2 | -12.1 | -33.5 | 59.7 | 56.3 | 92.7 |
| 18 and 19 years | -5.1 | -4.2 | -12.6 | 21.8 | 18.6 | 50.2 |
| 20 to 24 years | -2.7 | -1.9 | -9.1 | 11.8 | 10.5 | 21.2 |
| 25 to 34 years | -0.3 | -0.1 | -2.7 | 8.0 | 7.2 | 14.5 |
| 35 to 44 years | -0.6 | +0.2 | -7.3 | 7.5 | 6.5 | 16.4 |
| 45 to 54 years | -2.0 | -1.7 | -1.5 | 8.9 | 8.2 | 16.3 |
| 55 to 64 years | -5.8 | -5.4 | -10.0 | 12.9 | 12.1 | 22.5 |
| 65 years and over | -6.9 | -5.7 | -20.5 | 34.8 | 33.7 | 47.5 |
| Male, 14 years and over | -2.6 | -2.2 | -7.0 | 7.2 | 6.7 | 12.5 |
| 14 to 17 years | -16.5 | -14.3 | -36.4 | 48.9 | 45.1 | 83.3 |
| 18 and 19 years | -6.4 | -3.7 | -23.3 | 18.3 | 15.4 | 35.8 |
| 20 to 24 years | -2.5 | -1.8 | -7.9 | 7.5 | 6.9 | 11.2 |
| 25 to 34 years | -1.0 | -0.6 | -5.4 | 2.5 | 2.1 | 6.5 |
| 35 to 44 years | -1.0 | -0.7 | -4.0 | 2.2 | 1.8 | 5.9 |
| 45 to 54 years | -1.0 | -0.8 | -2.8 | 3.0 | 3.0 | 2.8 |
| 55 to 64 years | -3.5 | -3.5 | -3.3 | 7.8 | 7.6 | 10.7 |
| 65 years and over | -9.1 | -8.8 | -13.5 | 28.2 | 28.2 | 38.1 |
| Female, 14 years and over | -2.7 | -2.0 | -7.5 | 24.3 | 22.5 | 37.2 |
| 14 to 17 years | -9.4 | -7.7 | -26.8 | 81.7 | 78.6 | 114.0 |
| 18 and 19 years | -3.4 | -4.8 | +22.9 | 25.9 | 22.1 | 97.9 |
| 20 to 24 years | -3.0 | -2.0 | -10.9 | 18.5 | 16.0 | 37.1 |
| 25 to 34 years | +1.3 | +1.3 | +1.4 | 21.5 | 20.6 | 26.3 |
| 35 to 44 years | +0.3 | +2.2 | -11.6 | 19.0 | 17.2 | 30.3 |
| 45 to 54 years | -2.9 | -3.3 | +0.4 | 19.7 | 17.9 | 35.2 |
| 55 to 64 years | -10.7 | -9.6 | -20.4 | 23.9 | 22.0 | 40.9 |
| 65 years and over | -1.5 | +1.8 | -32.6 | 48.9 | 47.3 | 64.0 |
NOTE. Excludes cases with employment status not reported.
If the entries off the main diagonal in a 2 x 2 table, i.e., the cases in a particular category in one enumeration (CPS or census) but not in the other, are identified as d, the sum of all entries in the table as n (the universe), the proportion having the characteristic in the census as p, then the index of inconsistency can be defined as
The p (1-p) in the denominator of I is taken from the census because most of the response variability arises in the census.
Illustration: Table H presents the index of inconsistency for the labor force items from the 1950 and 1960 Censuses and indicates differences in the respective indexes of inconsistency, most of which are about the same although they are slightly favorable to the 1960 Census.
Table H. Index of Inconsistency for Matched Persons in Census- CPS "Match" Study, By Employment Status and Sex: 1960 and 1950
(Minus sign (-) indicates greater unreliability in 1960 Census than, in 1950 Census; plus sign (+) indicates greater unreliability in 1950 Census)
| Employment status and sex | Index of inconstistency (I) | Difference | |
| 1960 | 1950 | ||
| Male | |||
| Civilian labor force | .18 | .21 | +.03 |
| Employed | .17 | .20 | +.03 |
| Agriculture | .22 | .14 | -.08 |
| nonagriculture industries | .13 | .14 | +.01 |
| Unemployed | .50 | .51 | +.01 |
| Not in labor force | .18 | .21 | +.03 |
| Female | |||
| Civilian labor force | .19 | .19 | … |
| Employed | .17 | .18 | … |
| Agriculture | .59 | .96 | +.36 |
| nonagriculture industries | .16 | .14 | -.01 |
| Unemployed | .72 | .75 | +.03 |
| Not in labor force | .18 | .19 | … |
The term "United States" refers to the 50 States and the District of Columbia. The term "conterminous United States" refers to the United States exclusive of Alaska and Hawaii.
In general, the urban population comprises all persons living in urbanized areas and in places of 2,500 inhabitants or more outside urbanized areas. More specifically, according to the definition adopted for use in the 1960 Census, the urban population comprises all persons living in (a) places of 2,500 inhabitants or more incorporated as cities, boroughs, villages, and towns (except towns in New England, New York, and Wisconsin) ; (b) the densely settled urban fringe, whether incorporated or unincorporated, of urbanized areas; (c) towns in New England and townships in New Jersey and Pennsylvania which contain no Incorporated municipalities as subdivisions and have either 25,000 inhabitants or more or a population of 2,500 to 25,000 and a density of 1,500 persons or more per square mile; (d) counties In States other than the New England States, New Jersey, and Pennsylvania that have no incorporated municipalities within their boundaries and have a density of 1,500 persons or more per square mile; and (e) unincorporated places of 2,500 inhabitants or more. The population not classified as urban constitutes the rural population.
The rural population is subdivided into the rural- farm population, which comprises all rural residents living on farms, and the rural-nonfarm population, which comprises the remaining rural population. In the 1960 Census, the farm population consists of persons living in rural territory on places of 10 or more acres from which sales of farm products amounted to $50 or more in 1959 or on places of less than 10 acres from which sales of farm products amounted to $250 or more in 1959. All persons living in group quarters are classified as nonfarm except the relatively few living in workers' quarters (including quarters for migratory agricultural workers) that are located on a farm or ranch.
An urbanized area contains at least one city of 50,000 inhabitants or more in 1960 and the surrounding closely settled incorporated places and unincorporated areas that meet certain criteria relating to population density or land use. An urbanized area may be thought of as divided into the central city, or cities, and the remainder of the area, or the urban fringe. All persons residing in an urbanized area are included in the urban population.
The age classification is based on the age of the person in completed years as of April 1, 1960, as determined from the reply to a question on month and year of birth.
The three major race categories distinguished in this report are white, Negro, and other races. Among persons of "other races" are American Indians, Japanese, Chinese, Filipinos, Koreans, Hawaiians, Asian Indians, Eskimos, Aleuts, and Malayans. Negroes and persons of "other races" taken together constitute "nonwhite" persons. Persons of Mexican birth or descent who are not definitely of Indian or other non- white race are classified as white. In addition to persons of Negro and of mixed Negro and white descent, the category "Negro" includes persons of mixed Indian and Negro descent unless the Indian ancestry very definitely predominates or unless the person is regarded as an Indian in the community.
This category comprises persons born In the United States, the Commonwealth of Puerto Rico, or a possession of the United States; persons born in a foreign country or at sea who have at least one native American parent; and persons whose place of birth was not reported and whose census report contained no contradictory information, such as an entry of a language spoken prior to coming to the United States.
This category consists of native persons both of whose parents are also natives of the United States.
Residence on April 1, 1955, is the usual place of residence five years prior to enumeration. The category "same house as In 1960" includes all persons 5 years old and over who were reported as living in the same house on the date of enumeration in 1960 and five years prior to enumeration. Included in the group are persons who had never moved during the five years as well as those who had moved but by 1960 had returned to their 1955 residence. The category "different house in the U.S." includes persons who, on April 1, 1955, lived in the United States in a different house from the one they occupied on April 1, 1960. This category was subdivided into three groups according to their 1955 residence, viz., "different house, same county," "different county, same State," and "different State." The category "different State" was further divided into "contiguous State" and "noncontiguous State." States are classified as contiguous if their boundaries touch at any point. The category "abroad" includes those with residence in a foreign country or an outlying area of the United States in 1955. (In the coding of this item, persons who lived in Alaska or Hawaii in 1955 "but in other States in 1960 were classified as living in a different State in 1955.) Persons 5 years old and over who had indicated they had moved into their present residence after April 1, 1955) but for whom sufficiently .complete and consistent information regarding residence on April 1, 1955, was not collected are included in the group "moved, place of residence in 1955 not reported."
School enrollment is shown for persons 5 to 34 years old. Persons were included as enrolled in school if they were reported as attending or enrolled in a "regular" school or college at any time between February 1, 1960, and the time of enumeration. Regular schooling is that which may advance a person toward an elementary school certificate or high school diploma, or a college, university, or professional degree. Schooling that was not obtained in a regular school and schooling from a tutor or through correspondence courses were counted only if the credits obtained were regarded as transferable to a school in the regular school system. Schooling which is generally regarded as not regular includes that which is given in nursery schools, in specialized vocational, trade, or business schools; in on-the-job training; and through correspondence courses.
The data on years of school completed were derived from the answers to the two questions: (a) "What is the highest grade (or year) of regular school he has ever attended?" and (b) "Did he finish this grade (or year)?" Enumerators were instructed to obtain the approximate equivalent grade in the American school system for persons whose highest grade of attendance was in a foreign school system, whose highest level of attendance was in an ungraded school, whose highest level of schooling was measured by "readers," or whose training by a tutor was regarded as qualifying under the "regular" school definition. Persons were to answer "No" to the second question if they were attending school, had completed only part of a grade before they dropped out, or failed to pass the last grade attended.
The number in each category of highest grade of school completed represents the combination of (a) persons who reported that they had attended the indicated grade and finished it, and (b) those who had attended the next higher grade but had not finished it.
Elementary school, as defined here, includes grades 1 to 8, and high school includes grades 9 to 12. College includes junior or community colleges, regular 4-year colleges, and graduate or professional schools.
This classification refers to the marital status of the person at the time of enumeration. Persons classified as "married" comprise, therefore, both those who have been married, only once and those who remarried after having been widowed or divorced. Persons reported as separated (either legally separated or otherwise absent from the spouse because of marital discord) are classified as a subcategory of married persons. The enumerators were instructed to report persons in common-law marriages as married and persons whose only marriage had been annulled as single. Persons "ever married" are those in the categories married (including separated), widowed, and divorced.
The number of married men may be different from the number of married women for an area because of the absence of husbands or wives from the country, because the husband and wife have different places- of residence, because of the methods used to inflate the sample data, or for other reasons.
A married person with "spouse present" is a man or woman whose spouse was enumerated as a member of the same household even though he or she may have been temporarily absent on business or vacation, visiting, in a hospital, etc., at the time of enumeration. Persons classified as "married, spouse absent" includo both those who are separated because of marital discord and those whose spouse is absent for other reasons, such as service In the Armed Forces or employment at a considerable distance from home.
A household consists of all the persons who occupy a housing unit. A house, an apartment or other group of rooms, or a single room, is regarded as a housing unit when it is occupied or intended for occupancy ass separate living quarters; that is, when the occupants do not live and eat with any other persons in the structure and there is either (1) direct access from the outside or through a common hall or (2) a kitchen or cooking equipment for the exclusive use of the occupants.
All persons who are not members of households regarded as living in group quarters. Group quarters are living arrangements for institutional inmates or for other groups containing five or more persons unrelated to the person in charge. Most of the persons in group quarters live in rooming houses, college dormitories, military barracks, or institutions. Inmates of institutions are persons for whom care or custody is provided in such places as homes for delinquent or dependent children; homes and schools for the mentally or physically handicapped; places providing specialized medical care for persons with mental disorders, tuberculosis, or other chronic disease; nursing and domiciliary homes for the aged and dependent; prisons; and jails.
For persons in households, several categories of relationship to head of household are recognized in this report:
1.The head of the household is the member reported as the head by the household respondent. However, if a married woman living with her husband is reported as the head, her husband is classified as the head for the purpose of census tabulations.
2.The wife of a head of a household is a woman married to and living with a household head. This category includes women in common-law marriages as well as women in formal marriages.
3.An other relative of the head is a person related to the head of the household by blood, marriage, or adoption, but not included specifically in another category.
4.A nonrelative of the head is any member of the household who is not related to the household head. This category includes lodgers (roomers and partners, relatives of such persons, and foster children) and resident employees (maids, hired farm hands, etc.).
A family consists of two or more persons in the same household who are related to each other by blood, marriage, or adoption; all persons living in one household who are related to each other are regarded as one family. In a primary family, the head of the family is the head of the household. Other families are secondary families. A "husband-wife" family is a family in which the head and his wife are enumerated as members of the same household.
An own child is defined here as a single (never married) son, daughter, stepchild, or adopted child of the person in question. Only those children who are present in the home are included in the count of women by number of own children.
An own child is defined here as a single (never married) son, daughter, stepchild, or adopted child of the person in question. Only those children who are present in the home are included in the count of women by number of own children.
The number of children ever born includes children born to the woman before her present marriage, children no longer living, and children away from home, as well as children borne by the woman who were still living in the home. Although the question on children ever born was asked only of women reported as having been married, the data are not limited to legitimate births.
Information on income for the calendar year 1959 was requested from all persons 14 years old and over in the sample. "Total income" is the sum of amounts reported separately for wage or salary Income, self-employment income, and other income. Wage or salary income is defined as the total money earnings received for work performed as an employee. It represents the amount received before deductions for personal income taxes, Social Security, bond purchases, union dues, etc. Self-employment income is defined as net money income (gross receipts minus operating expenses) from a business, farm, or professional enterprise in which the person was engaged on his own account. Other income includes money income received from such sources as net rents, interest, dividends, Social Security benefits, pensions, veterans' payments, unemployment insurance, and public assistance or other governmental payments, and periodic receipts from insurance policies or annuities. Not included as income are money received from the sale of property (unless the recipient was engaged in the business of selling such property), the value of income "in kind," withdrawals of bank deposits, money borrowed, tax refunds, and gifts and lump-sum inheritances or insurance payments.
In the statistics on family income, the combined incomes of all members of each family are treated as a single amount. Although the time period covered by the income statistics is the calendar year 1959, the composition of families refers to the time of enumeration. For most of the families, however, the income reported was received by persons who were members of the family throughout 1959.
In the statistics on family income, the combined incomes of all members of each family are treated as a single amount. Although the time period covered by the income statistics is the calendar year 1959, the composition of families refers to the time of enumeration. For most of the families, however, the income reported was received by persons who were members of the family throughout 1959.

