


| Documentation: | ACS 2018 (1-Year Estimates) |
you are here:
choose a survey
survey
document
chapter
Publisher: U.S. Census Bureau
Survey: ACS 2018 (1-Year Estimates)
| Document: | 2018 ACS 1-year and 2014-2018 ACS 5-year Data Releases: Technical Documentation |
| citation: | Social Explorer; U.S. Census Bureau; 2018 ACS 1-year and 2014-2018 ACS 5-year Data Releases : Technical Documentation. |
Chapter Contents
2018 ACS 1-year and 2014-2018 ACS 5-year Data Releases: Technical Documentation
The American Community Survey (ACS) Summary File is a comma-delimited text file that contains all the Detailed Tables for the ACS. Data users with programming skills and access to statistical software can use the Summary File to download and analyze ACS data for a wide range of geographic areas.
This guide provides an overview of the ACS Summary File and how it can be used to access data on America's communities.
This guide provides an overview of the ACS Summary File and how it can be used to access data on America's communities.
The ACS is a nationwide survey designed to provide communities with reliable and timely social, economic, housing, and demographic data every year. A separate annual survey, called the Puerto Rico Community Survey (PRCS), collects similar data about the population and housing units in Puerto Rico. The U.S. Census Bureau uses data collected in the ACS and the PRCS to provide estimates on a broad range of population, housing unit, and household characteristics for states, counties, cities, school districts, congressional districts, census tracts, block groups, and many other geographic areas.
The ACS has an annual sample size of about 3.5 million addresses, with survey information collected nearly every day of the year. Data are pooled across a calendar year to produce estimates for that year. As a result, ACS estimates reflect data that have been collected over a period of time rather than for a single point in time, as in the decennial census, which is conducted every 10 years and provides population counts as of April 1 of the census year.
ACS 1-year estimates are data that have been collected over a 12-month period and are available for geographic areas with at least 65,000 people. Starting with the 2014 ACS, the Census Bureau is also producing "1-year Supplemental Estimates"--simplified versions of popular ACS tables--for geographic areas with at least 20,000 people. The Census Bureau combines 5 consecutive years of ACS data to produce multiyear estimates for geographic areas with fewer than 65,000 residents. These 5-year estimates represent data collected over a period of 60 months.
For more detailed information about the ACS--how to judge the accuracy of ACS estimates, understanding multiyear estimates, knowing which geographic areas are covered in the ACS, and how to access ACS data on the Census Bureau's Web site--see the Census Bureau's handbook on Understanding and Using American Community Survey Data: What All Data Users Need to Know. 1
Footnotes:
1 U.S. Census Bureau, Understanding and Using American Community Survey Data: What All Data Users Need to Know, www.census.gov/programs-surveys/acs/guidance/handbooks/general.html.
The ACS Summary File is a unique data product that includes all estimates and margins of error from the Detailed Tables for all geographies that are published for the ACS. Other ACS data products, such as Subject Tables and Data Profiles, are created from the Detailed Tables and, therefore, are not available in the ACS Summary File.2
The ACS Summary File is in American Standard Code for Information Interchange (ASCII) format. The file is divided into three types:
Since the Detailed Tables contain a large number of cells, the tables are stored in a series of files, called sequences, containing only the estimates from the tables. The sequences exclude metadata such as the titles of the tables, the descriptions of the rows, and the names of the geographic areas. The metadata is stored in other files that you must merge with the data files to reproduce the complete tables. Learn more about metadata in Sections 2 and 3.
The ACS Summary File can be challenging to use and is intended for advanced users who work with statistical software. The Census Bureau provides programs written in SAS that can be used to access and process the data. There is also an Excel-based tool for those without access to a statistical package. However, before using the Summary File, users should first check if the data of interest are easily available for download on data.census.gov--the Census Bureau's new data dissemination platform.3
Section 4 provides information about tools to help you access the tables you need. You can access these tools through the Summary File Documentation on the Census Bureau's ACS Web site.4
Footnotes:
2 For information about the types of ACS tables that are available, see the Census Bureau's Table IDs Explained Web page, www.census.gov/programs-surveys/acs/guidance/which-data-tool/table-ids-explained.html.
3 U.S. Census Bureau, data.census.gov, https://data.census.gov.
4 U.S. Census Bureau, American Community Survey (ACS), Summary File Documentation, www.census.gov/programs-surveys/acs/technical-documentation/summary-file-documentation.html.
The ACS Summary File is in American Standard Code for Information Interchange (ASCII) format. The file is divided into three types:
- Geographies--(position based and comma delimited).
- Estimates--(comma delimited).
- Margins of Error--(comma delimited).
Since the Detailed Tables contain a large number of cells, the tables are stored in a series of files, called sequences, containing only the estimates from the tables. The sequences exclude metadata such as the titles of the tables, the descriptions of the rows, and the names of the geographic areas. The metadata is stored in other files that you must merge with the data files to reproduce the complete tables. Learn more about metadata in Sections 2 and 3.
The ACS Summary File can be challenging to use and is intended for advanced users who work with statistical software. The Census Bureau provides programs written in SAS that can be used to access and process the data. There is also an Excel-based tool for those without access to a statistical package. However, before using the Summary File, users should first check if the data of interest are easily available for download on data.census.gov--the Census Bureau's new data dissemination platform.3
Section 4 provides information about tools to help you access the tables you need. You can access these tools through the Summary File Documentation on the Census Bureau's ACS Web site.4
Footnotes:
2 For information about the types of ACS tables that are available, see the Census Bureau's Table IDs Explained Web page, www.census.gov/programs-surveys/acs/guidance/which-data-tool/table-ids-explained.html.
3 U.S. Census Bureau, data.census.gov, https://data.census.gov.
4 U.S. Census Bureau, American Community Survey (ACS), Summary File Documentation, www.census.gov/programs-surveys/acs/technical-documentation/summary-file-documentation.html.
Because the ACS Summary File provides access to all the Detailed Tables for all available geographies, it enables data users to more easily:
- Connect data across tables, for example calculate the number of people living in census tracts with at least 30 percent of the population living in poverty.
- Filter the data based on specified criteria, for example only extract data for table totals and selected estimates.
- Recode variables, for example aggregate data across several categories or calculate rates and percentages.
- Produce tabulations across many subjects and geographies, for example tables about educational attainment, poverty, disability, and commuting for all 50 states, the District of Columbia, and Puerto Rico.
The ACS Summary File covers geographic areas based on "summary levels." A summary level specifies the content and the hierarchical relationships of the geographic elements that are required to tabulate and summarize data.
Summary levels range from very large reporting units such as "State" to much smaller reporting units such as "Census Tract." Summary levels may nest within other geographic areas, such as "State" to "County" to "Census Tract," or they may cross between two or more geographic hierarchies to produce units that are only portions of geographic areas. For example, summary level "State-Place-County" crosses the "State-Place" hierarchy with the "State-County" hierarchy and may create units that cover only a portion of one county.
Each summary level has an assigned three-digit summary level code to help data users link each summary level to its appropriate use in a table, map, or other data summarization format. Here are some common summary levels used to identify types of geographic areas:
Many resources are available to help users understand the ACS geographic terms and concepts. For additional information, refer to the Census Bureau's Geography Reference Manual and Geography and ACS Web page.6
Footnotes:
5 U.S. Census Bureau, Geography Program, Cartographic Boundary File Summary Level Codes, www.census.gov/programs-surveys/geography/technical-documentation/naming-convention/cartographic-boundary-file/carto-boundary-summary-level.html.
6 U.S. Census Bureau, Geography Program, Geographic Areas Reference Manual, www.census.gov/programs-surveys/geography/guidance/geographic-areas-reference-manual.html; and U.S. Census Bureau, American Community Survey (ACS), Geography and ACS, www.census.gov/programs-surveys/acs/geography-acs.html.
Summary levels range from very large reporting units such as "State" to much smaller reporting units such as "Census Tract." Summary levels may nest within other geographic areas, such as "State" to "County" to "Census Tract," or they may cross between two or more geographic hierarchies to produce units that are only portions of geographic areas. For example, summary level "State-Place-County" crosses the "State-Place" hierarchy with the "State-County" hierarchy and may create units that cover only a portion of one county.
Each summary level has an assigned three-digit summary level code to help data users link each summary level to its appropriate use in a table, map, or other data summarization format. Here are some common summary levels used to identify types of geographic areas:
- 010 Nation
- 020 Region
- 030 Division
- 040 State
- 050 State-County
- 140 State-County-Census Tract
- 250 American Indian Area/Alaska Native Area/
- Hawaiian Home Land
- 310 Metropolitan Statistical Area/Micropolitan Statistical Area
- 500 State-Congressional District
Many resources are available to help users understand the ACS geographic terms and concepts. For additional information, refer to the Census Bureau's Geography Reference Manual and Geography and ACS Web page.6
Footnotes:
5 U.S. Census Bureau, Geography Program, Cartographic Boundary File Summary Level Codes, www.census.gov/programs-surveys/geography/technical-documentation/naming-convention/cartographic-boundary-file/carto-boundary-summary-level.html.
6 U.S. Census Bureau, Geography Program, Geographic Areas Reference Manual, www.census.gov/programs-surveys/geography/guidance/geographic-areas-reference-manual.html; and U.S. Census Bureau, American Community Survey (ACS), Geography and ACS, www.census.gov/programs-surveys/acs/geography-acs.html.
The ACS Summary File contains the same data as the Detailed Tables but in a more flexible format to allow data users to extract only the desired data.
Figure 1.1 shows an example using a table from data.census.gov, and Figure 1.2 shows the corresponding estimates from the Summary File. The published table includes information such as the table ID (B17001), the table title ("Poverty Status in the Past 12 Months by Sex by Age"), and the source file ("2017 American Community Survey 1-year Estimates"). The body of the table provides the estimates and margins of error for each selected geography (in this case, counties in New Jersey). The highlighted box shows that in 2017, there were 263,996 people whose poverty status was determined in Atlantic County, New Jersey, and there were 39,172 people whose income in the past 12 months was below the poverty level.
As shown in Figure 1.2, the Summary File does not contain any of the metadata that is included in the published table. Rather, the file only contains the estimates and they are separated by commas. The estimates are the same but in a different format.
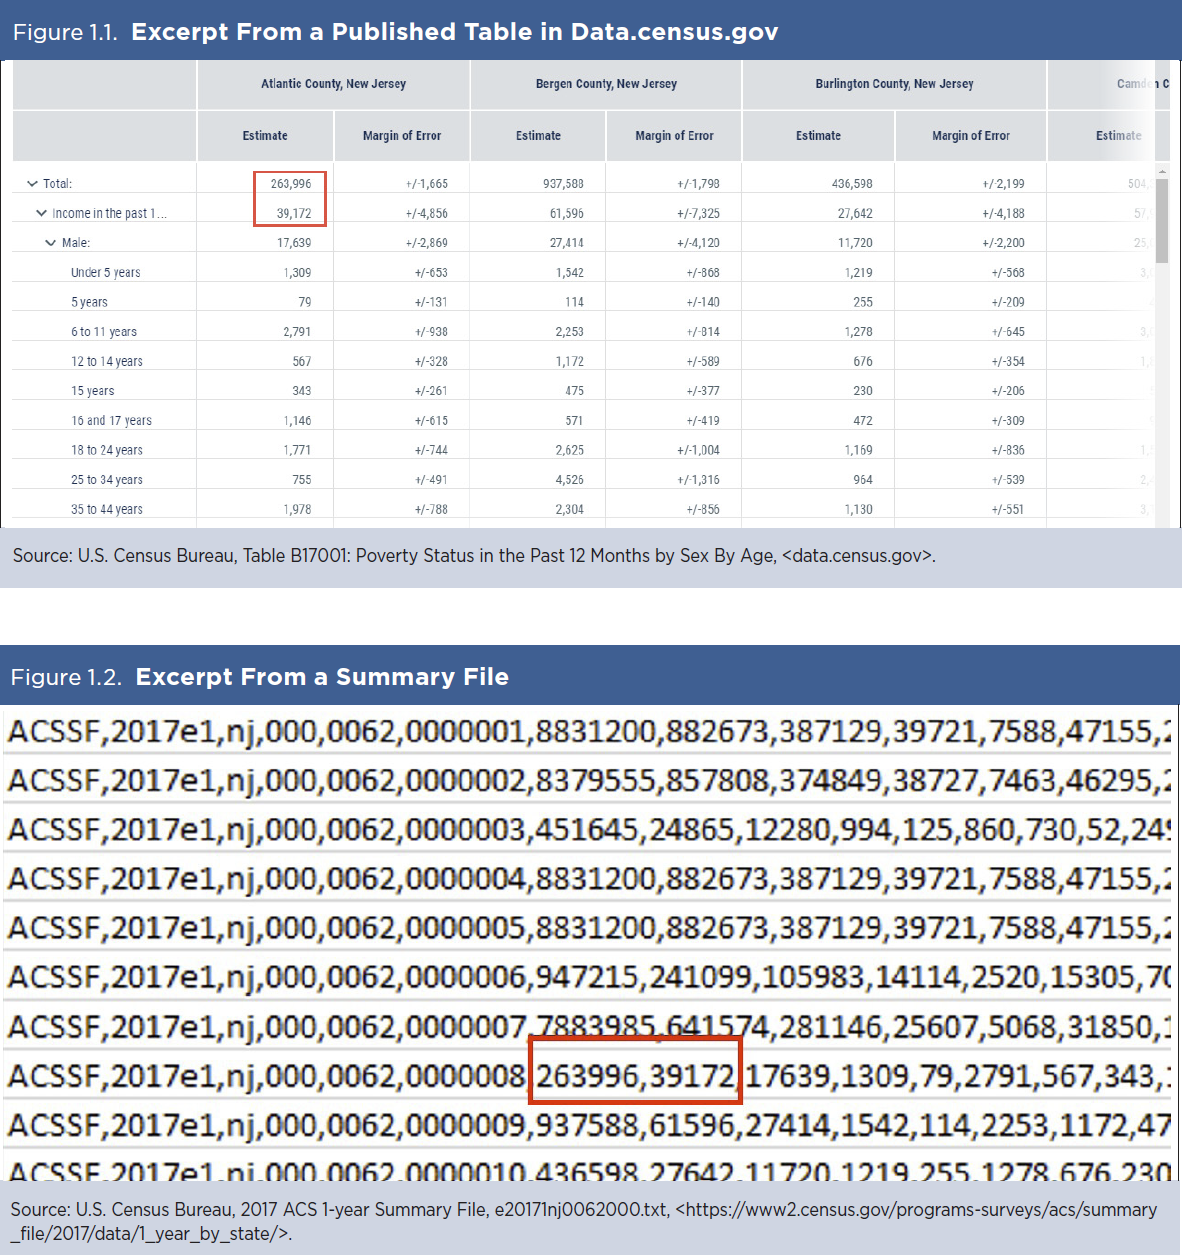
You can learn more details about each data release by visiting the ACS Data Releases page on the Census Bureau's Web site.7 This page includes a schedule, notes about new estimates or new guidance, and technical information about geography and product changes. Check the updated data release information before using the Summary File, as changes may impact the table sequences or geographies. You can also browse notes from previous years.
Footnotes:
7 U.S. Census Bureau, American Community Survey (ACS), Data Releases, www.census.gov/programs-surveys/acs/news/data-releases.html.
Footnotes:
7 U.S. Census Bureau, American Community Survey (ACS), Data Releases, www.census.gov/programs-surveys/acs/news/data-releases.html.
To use the American Community Survey (ACS) Summary File, data users should follow the steps outlined below.
Footnotes:
8 U.S. Census Bureau, American Community Survey (ACS), Summary File Documentation, www.census.gov/programs-surveys/acs/technical-documentation/summary-file-documentation.html. .
- Locate the files that you need. ACS Summary File data are stored on the U.S. Census Bureau's file transfer protocol (FTP) server in zipped files. The desired Summary File data need to be downloaded and unzipped.
-
Data users will need to download:
◦ Geography file(s).
◦ Estimate file(s).
◦ Margin of error file(s).
◦ Excel templates and Instructions on How to Read the ACS Summary File into Excel (if using Excel).
◦ SAS programs and/or SAS macro code (if using SAS). - Identify the tables of interest. The Summary File Documentation on the ACS Web site includes a series of Excel workbooks that provide a complete list of the tables that are in the Summary File, as well as table IDs, sequence numbers, the starting and ending positions for the table data, and any geographic restrictions.8 Sequence numbers uniquely identify tables within a given subject.The Sequence Number/Table Number Lookup Files provide information about the relationship between sequence numbers and tables, as well as the line numbers for the individual data points. Learn more about identifying tables in Section 3.
- Identify the tool that you will use to retrieve the desired tables. The Census Bureau provides instructions on how to access tables in the Summary File using Excel and SAS. Learn more about using these tools in Section 4. Advanced data users can also write their own programs using other statistical software.
Footnotes:
8 U.S. Census Bureau, American Community Survey (ACS), Summary File Documentation, www.census.gov/programs-surveys/acs/technical-documentation/summary-file-documentation.html. .
The ACS Summary File is located on the Census Bureau's file transfer protocol (FTP) server.9 The file can be reached by navigating through the FTP site in a few different ways. The easiest way is to start at the ACS Web site.10 Then select the desired data release.
From the ACS main page, , click on the "Data" tab in the left navigation, select the option for "Summary File Data," as shown in Figure 2.1.
This will take you to the ACS Summary File page. Select the desired data year and then click on "1-Year Summary File" (see Figure 2.2) or "5-Year Summary File" to go to the ACS Summary File FTP site.
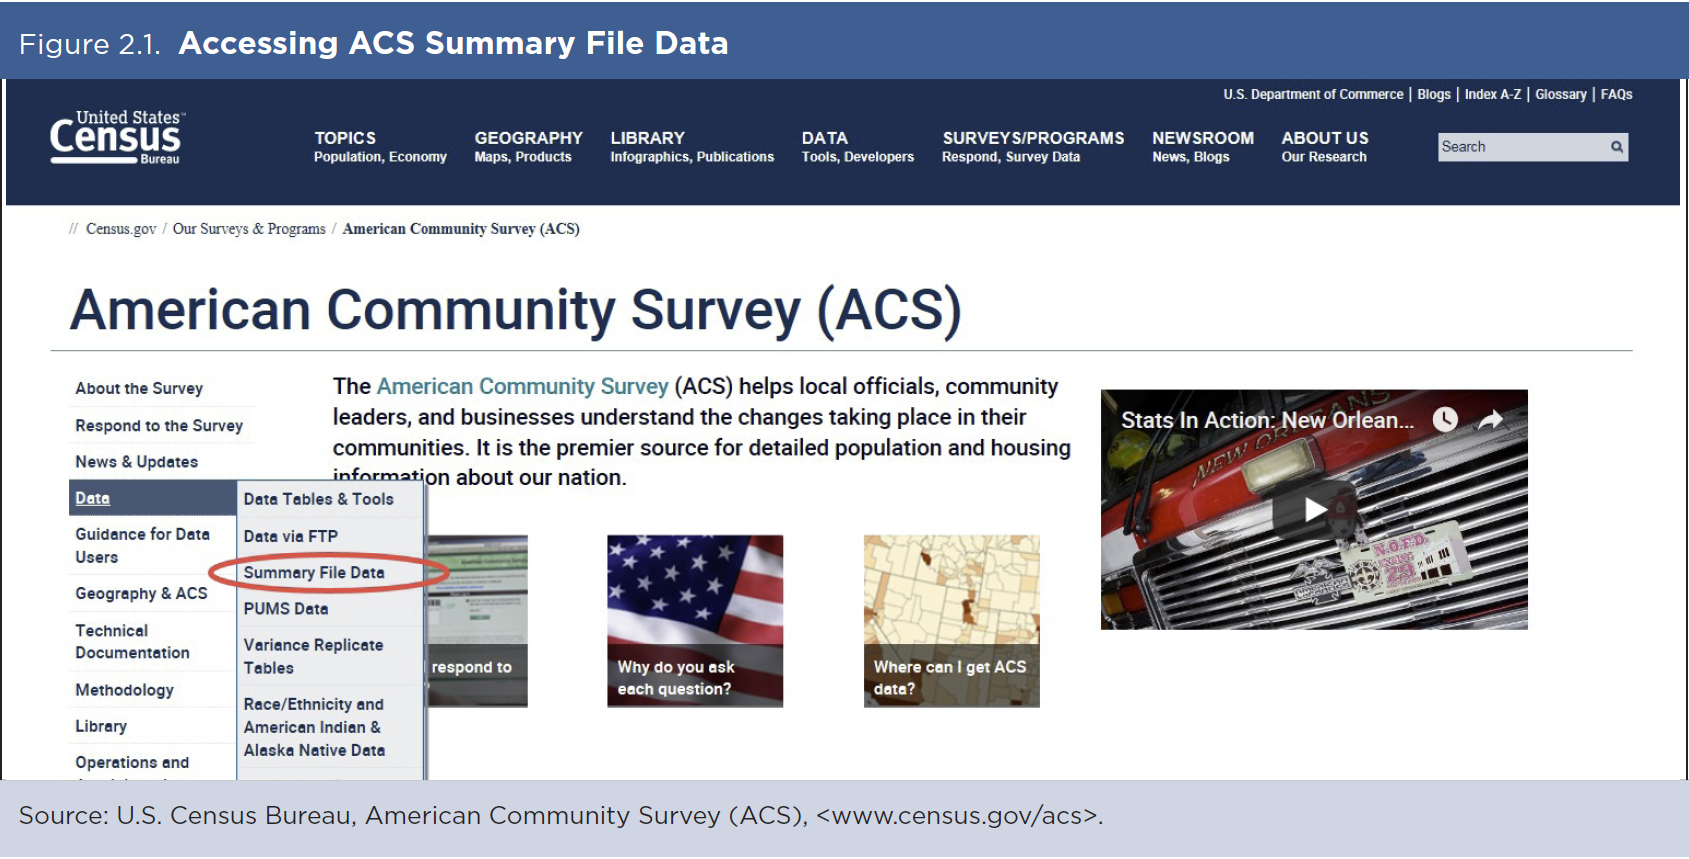
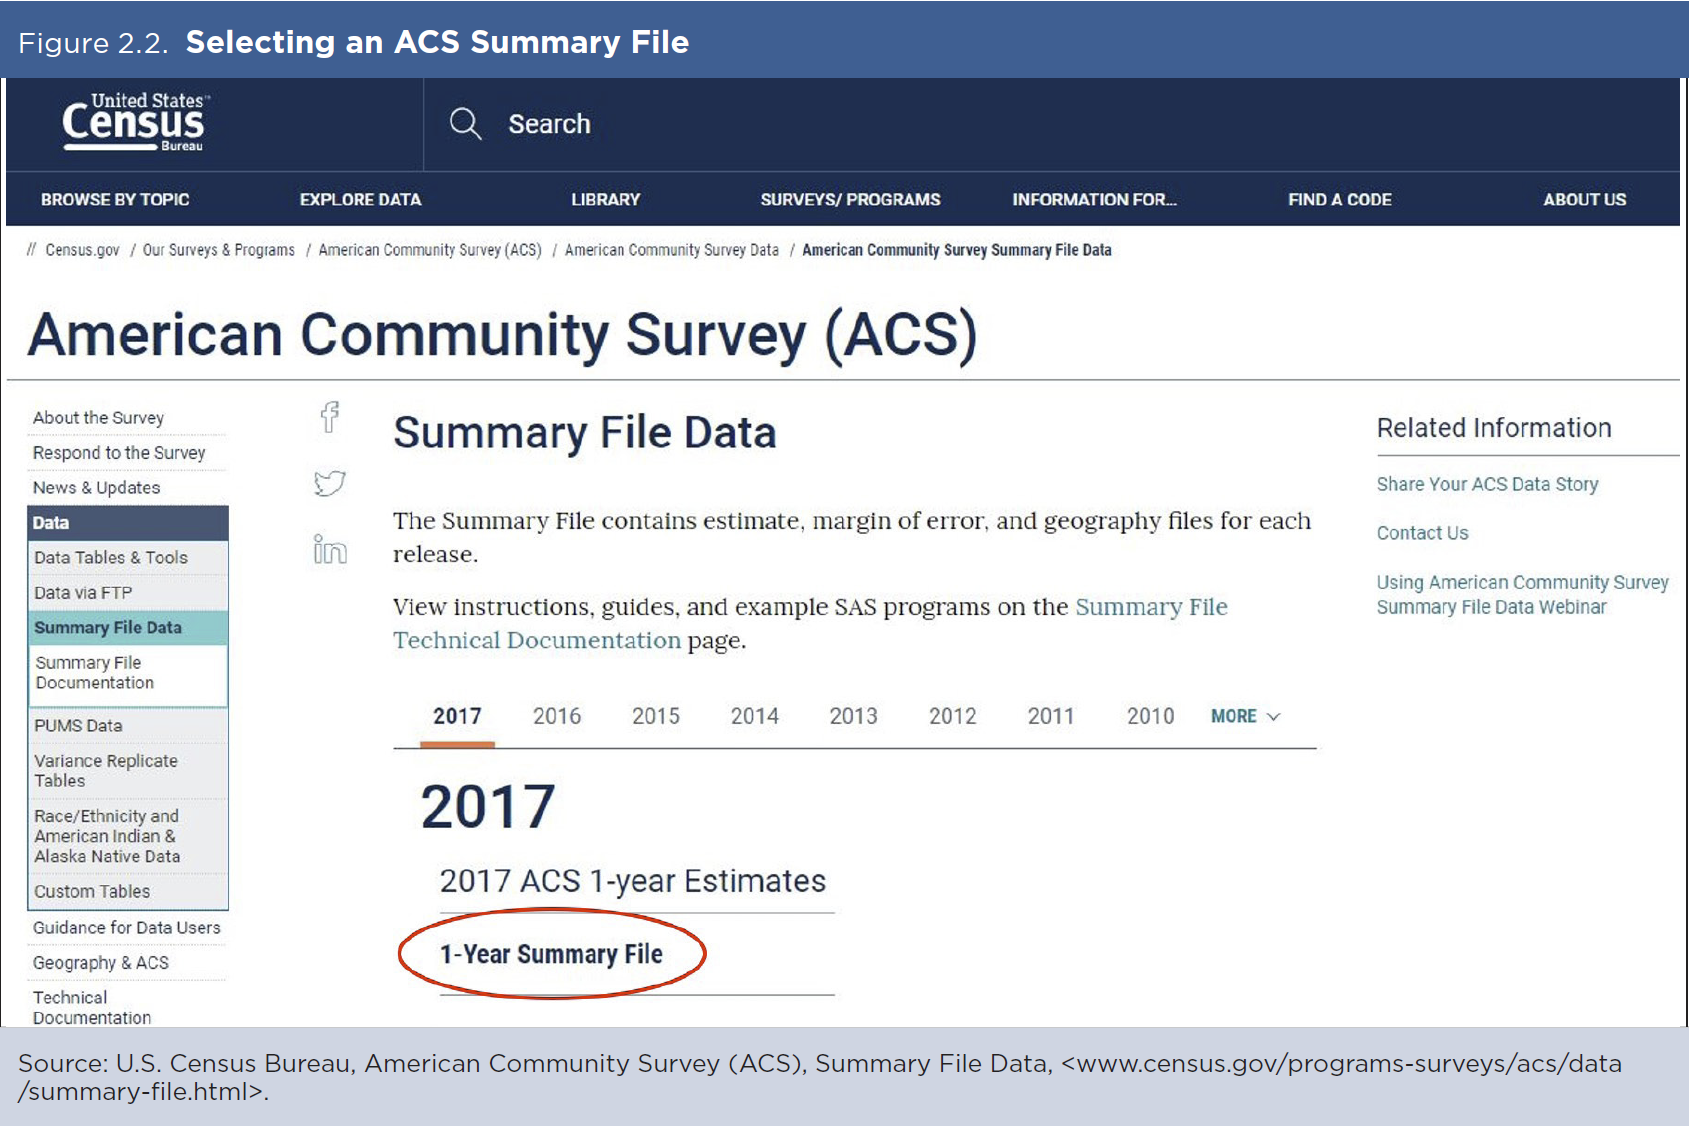
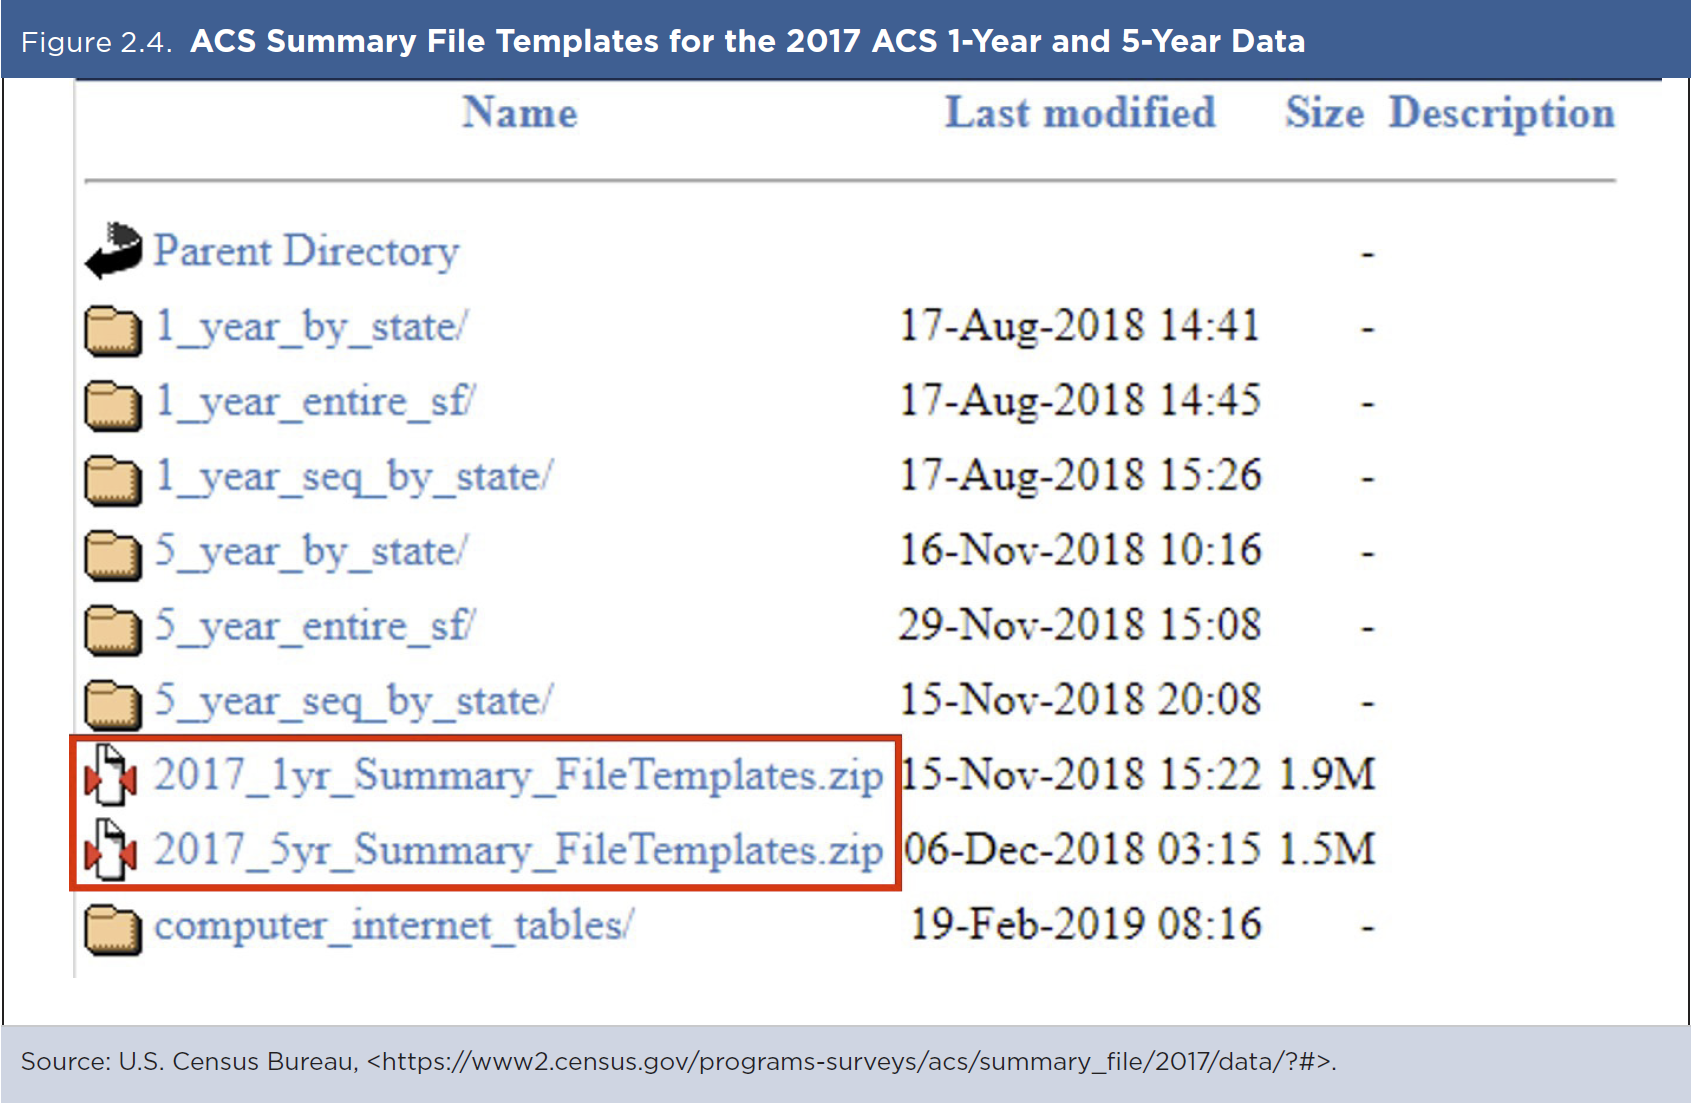
Figure 2.3 shows the ACS Summary File directory for the 2017 ACS 1-year and 5-year data files. As described in the next section, each file is actually comprised of three folders, as well as templates, for each data release.
Footnotes:
9 U.S. Census Bureau, American Community Survey (ACS), Data via FTP, www.census.gov/programs-surveys/acs/data/data-via-ftp.html.
10 U.S. Census Bureau, American Community Survey (ACS), www.census.gov/programs-surveys/acs.
The ACS Summary File is organized in three directories per data release. For example, data users have a choice of three ACS 1-year Summary File directories:
Each of the three directories is further subdivided into three types of files: geography, estimate, and margin of error files, which are available for each of the 50 states, the District of Columbia, Puerto Rico, and cross-state geographies such as metropolitan statistical areas. The geography files start with "g," the estimate files start with "e," and the margin of error files start with "m." Lastly, the estimate and margin of error files are segmented by "sequence." Each sequence contains the data points for a single table or multiple tables within the same subject area. This means that the Summary File is actually a set of over 10,000 files. Learn more about sequences in Section 3.
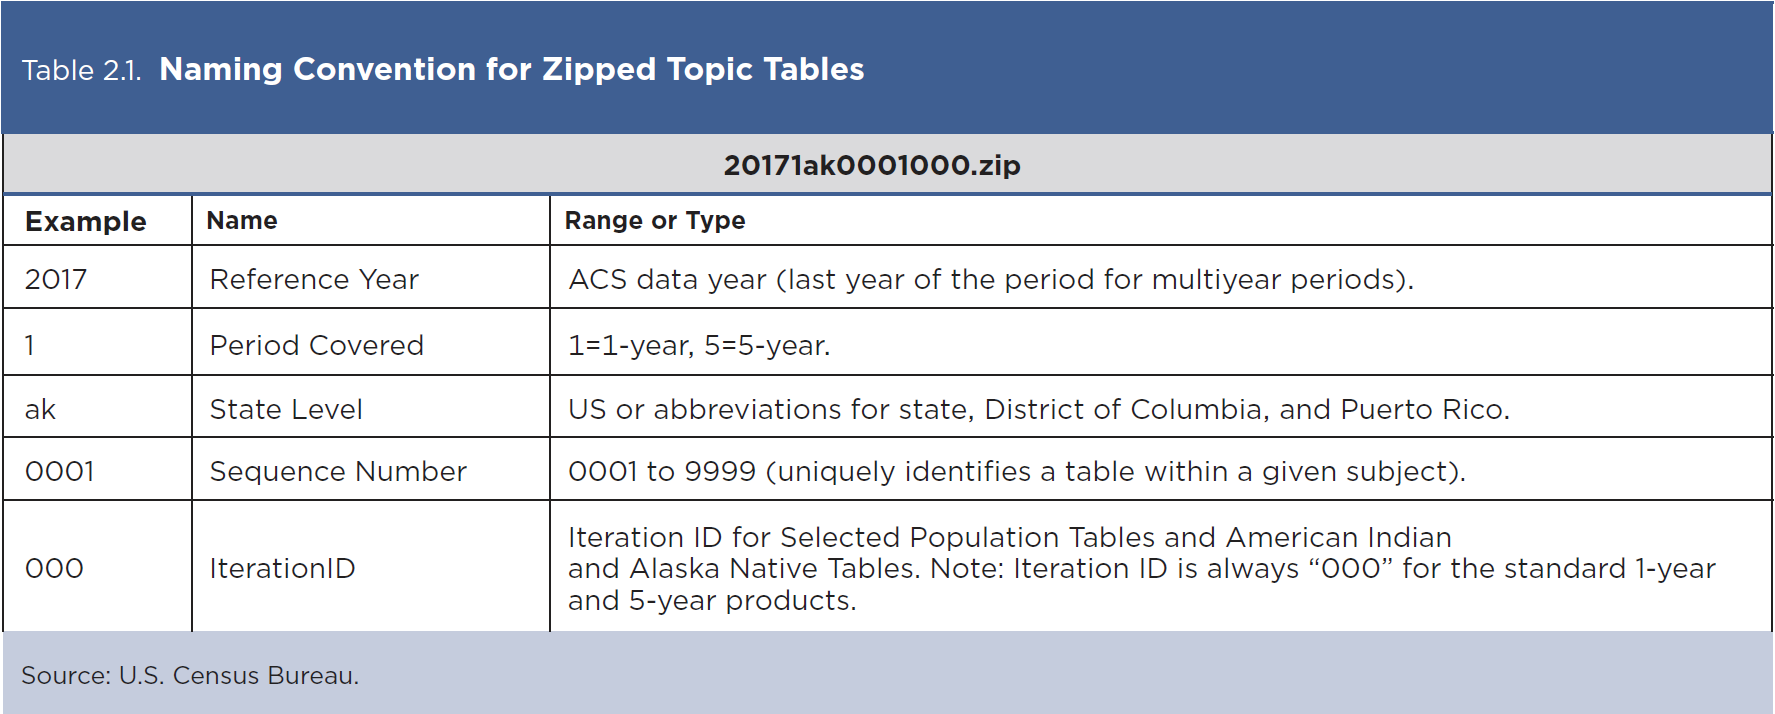
Table 2.1 shows the naming convention used for a selected zipped file in the "1_year_seq_by_state" directory. In the file name, "ak" refers to the State of Alaska.
- 1_year_entire_sf (entire summary file).
- 1_year_by_state (summary file subdivided by state).
- 1_year_seq_by_state (summary file subdivided by state and sequence).
Each of the three directories is further subdivided into three types of files: geography, estimate, and margin of error files, which are available for each of the 50 states, the District of Columbia, Puerto Rico, and cross-state geographies such as metropolitan statistical areas. The geography files start with "g," the estimate files start with "e," and the margin of error files start with "m." Lastly, the estimate and margin of error files are segmented by "sequence." Each sequence contains the data points for a single table or multiple tables within the same subject area. This means that the Summary File is actually a set of over 10,000 files. Learn more about sequences in Section 3.
- All-in-one directory (1_year_entire_sf, 5_year_entire_sf)
- State table directory (1_year_by_state, 5_year_by_state)
- Topic table directory (1_year_seq_by_state, 5_year_seq_by_state)
Table 2.1 shows the naming convention used for a selected zipped file in the "1_year_seq_by_state" directory. In the file name, "ak" refers to the State of Alaska.
- Templates (1yr_Summary_FileTemplates.zip, 5yr_SummaryFileTemplates.zip)
- 5-year Summary File organization
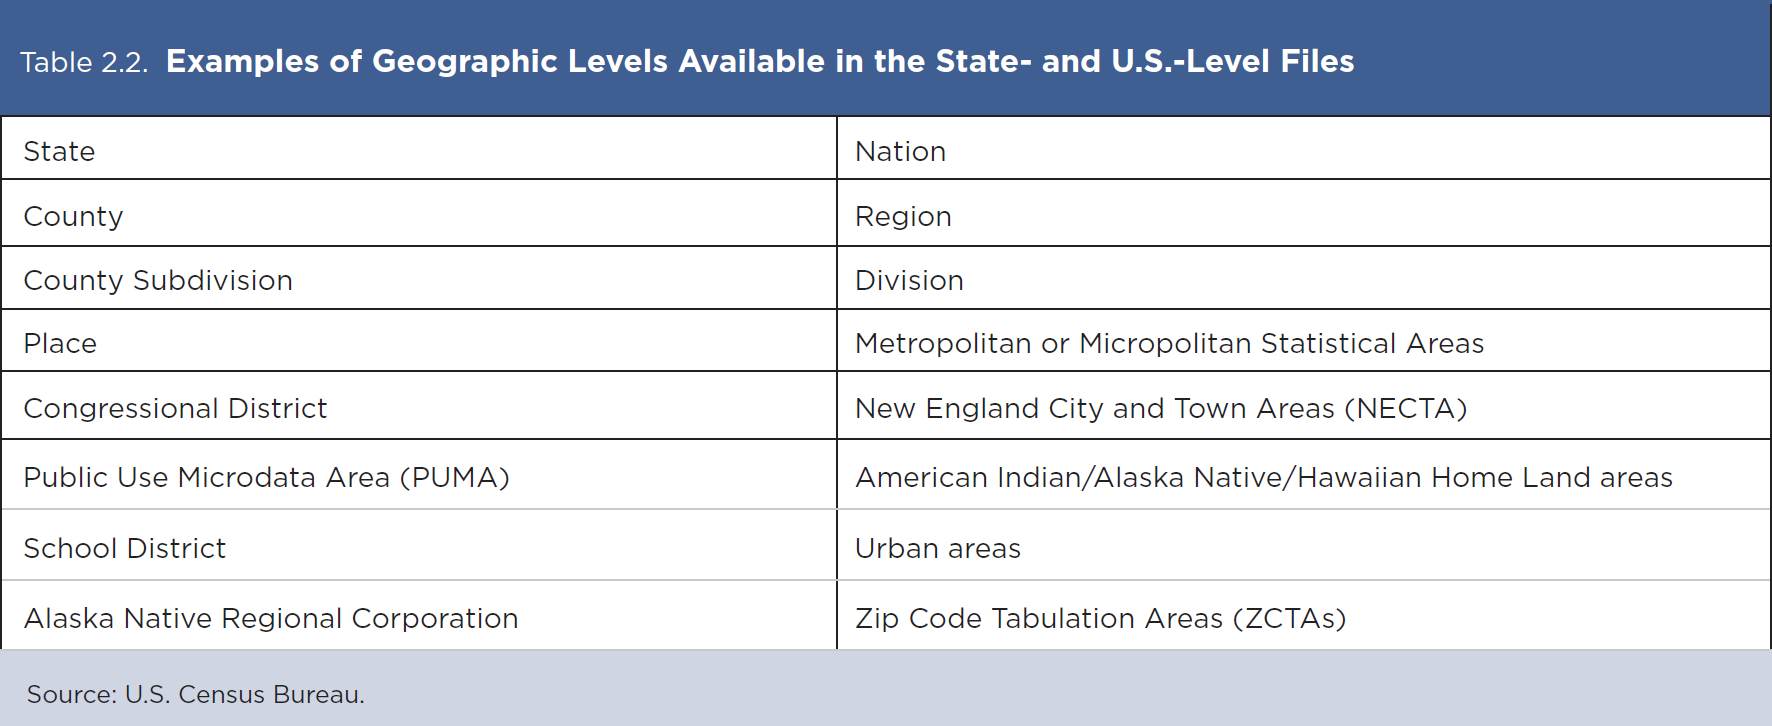
The ACS Summary File is organized so there is a set of files for each state or state-level equivalent (District of Columbia and Puerto Rico). Each state-level file contains the data for the geographic levels that are always entirely within a state, such as counties and places. There is also a file called "United States," which includes the data for the geographic areas that cross state boundaries such as the nation, regions, divisions, metropolitan statistical areas, Zip Code Tabulation Areas (ZCTAs), and tribal areas. The U.S. level does not contain tables for geographies that are entirely within a state.
Table 2.2 lists the geographic levels available in the state- and U.S.-level files.
Each geography has a single geography file associated with it, regardless of how the ACS Summary File is accessed. The geography files are used to link the geographic information for an area to the data in the estimate and margin of error files. To link the files together, merge the geography file with the estimate and margin of error files using the variable, LOGRECNO, the logical record number. Geography files begin with a "g" and are ASCII files using either a position-based format (.txt) or comma-delimited format (.csv).
Geography files follow a specific naming convention. Table 2.3 shows the naming convention used for the 1-year geography ("g") file for Alaska ("ak").
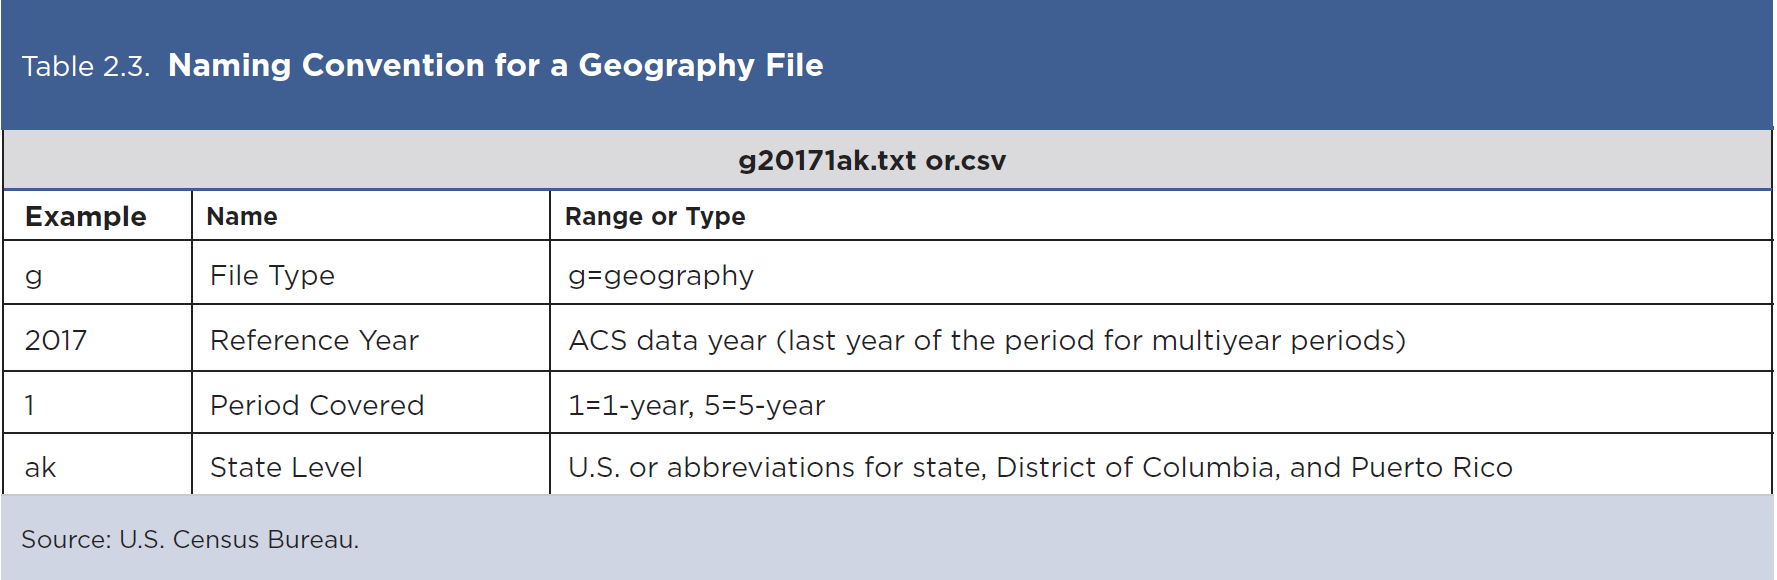
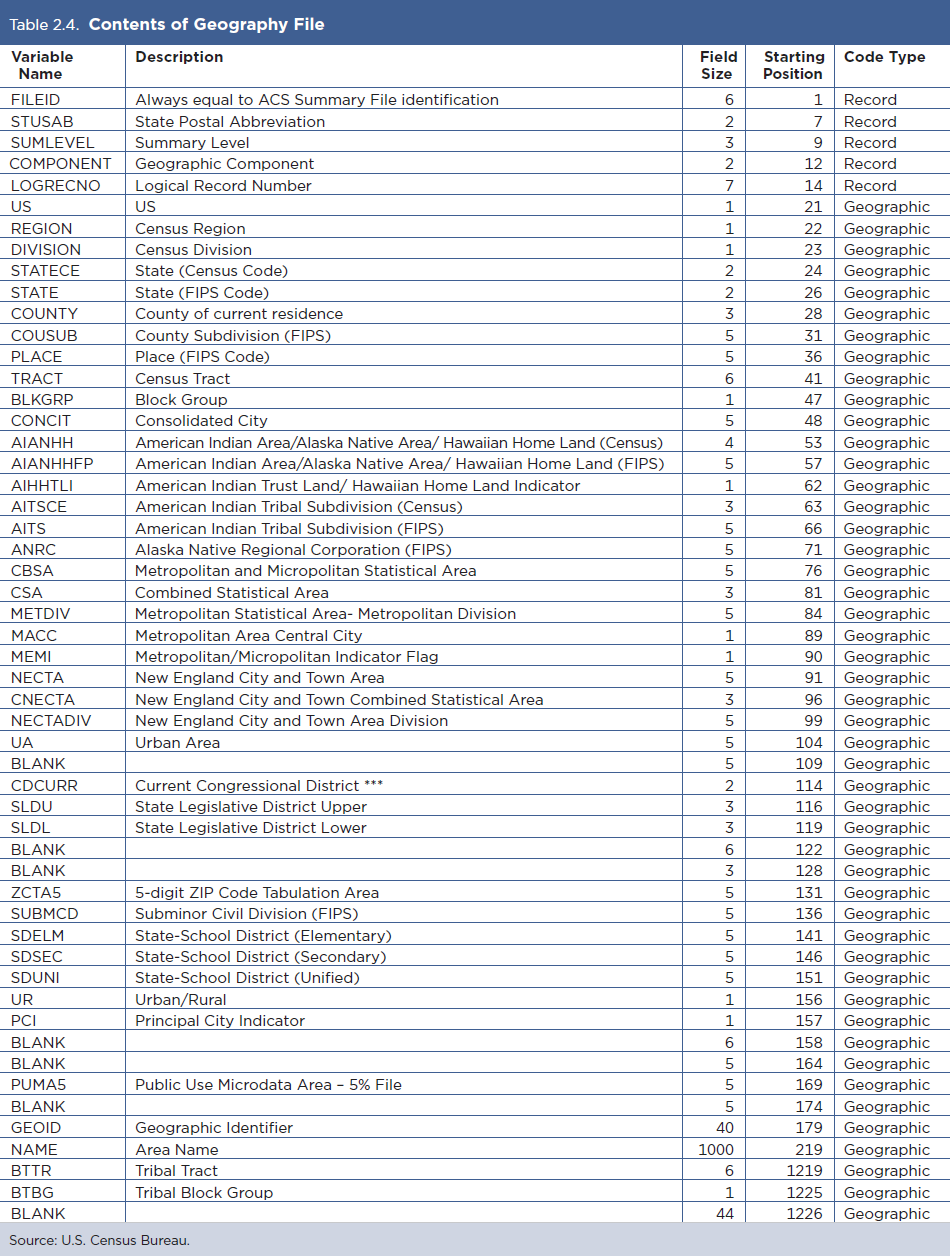
Table 2.4 shows the contents of the geography file, which is available in both .csv and .txt formats. Each row represents a different geographic area, and the first five fields contain metadata, such as the state postal abbreviation and logical record number.
Following those fields are the different geographic levels available for a particular data release. The fields in the table are blank if the geographic level is not available for a particular data release.
The Census Bureau also provides data users with an Excel template for each geography file. These templates include two rows containing the variable names and their descriptions for each column in the geography file. The Excel files are meant to be used with the comma-delimited versions of the geography files.
They are available in the zipped template files in the main Summary File directory and on the Summary File data page.11 Figure 2.5 shows a screenshot of the Excel template for 2017 (named "2017_SFGeoFileTemplate.xls," which can be found in either 2017_1yr_Summary_FileTemplates.zip or 2017_5yr_Summary_FileTemplates.zip).
Figure 2.6 shows the first few rows of the text-file version of the geography file for Maryland, though not all columns are shown here. Each row in the file represents a geographic area. The first row corresponds with the state of Maryland, the 12th row with Anne Arundel County, and the 13th row with Baltimore County. The logical record numbers for these geographies are circled below: for the state of Maryland it is "0000001," for Anne Arundel County it is "0000012," and for Baltimore County it is "0000013."

Footnotes:
11 U.S. Census Bureau, American Community Survey (ACS), Summary File Documentation, www.census.gov/programs-surveys/acs/data/summary-file.html.
Table 2.2 lists the geographic levels available in the state- and U.S.-level files.
Each geography has a single geography file associated with it, regardless of how the ACS Summary File is accessed. The geography files are used to link the geographic information for an area to the data in the estimate and margin of error files. To link the files together, merge the geography file with the estimate and margin of error files using the variable, LOGRECNO, the logical record number. Geography files begin with a "g" and are ASCII files using either a position-based format (.txt) or comma-delimited format (.csv).
Geography files follow a specific naming convention. Table 2.3 shows the naming convention used for the 1-year geography ("g") file for Alaska ("ak").
Table 2.4 shows the contents of the geography file, which is available in both .csv and .txt formats. Each row represents a different geographic area, and the first five fields contain metadata, such as the state postal abbreviation and logical record number.
Following those fields are the different geographic levels available for a particular data release. The fields in the table are blank if the geographic level is not available for a particular data release.
The Census Bureau also provides data users with an Excel template for each geography file. These templates include two rows containing the variable names and their descriptions for each column in the geography file. The Excel files are meant to be used with the comma-delimited versions of the geography files.
They are available in the zipped template files in the main Summary File directory and on the Summary File data page.11 Figure 2.5 shows a screenshot of the Excel template for 2017 (named "2017_SFGeoFileTemplate.xls," which can be found in either 2017_1yr_Summary_FileTemplates.zip or 2017_5yr_Summary_FileTemplates.zip).
Figure 2.6 shows the first few rows of the text-file version of the geography file for Maryland, though not all columns are shown here. Each row in the file represents a geographic area. The first row corresponds with the state of Maryland, the 12th row with Anne Arundel County, and the 13th row with Baltimore County. The logical record numbers for these geographies are circled below: for the state of Maryland it is "0000001," for Anne Arundel County it is "0000012," and for Baltimore County it is "0000013."
Footnotes:
11 U.S. Census Bureau, American Community Survey (ACS), Summary File Documentation, www.census.gov/programs-surveys/acs/data/summary-file.html.
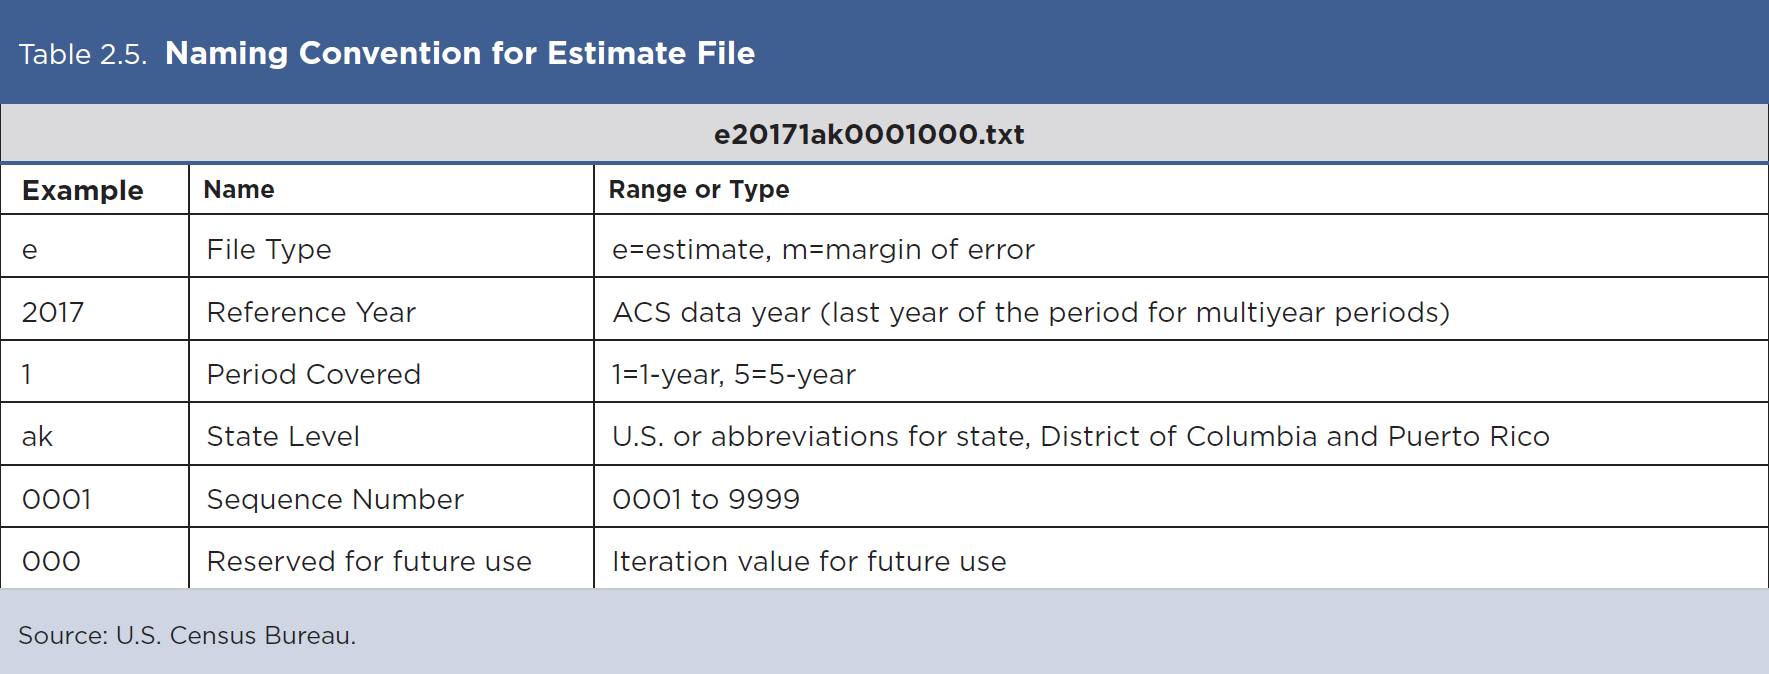
In the ACS Summary File, published estimates and their associated margins of error are available in separate files. Individual files also follow a specific naming convention. Table 2.5 shows the naming convention used for a selected estimate ("e") file for Alaska ("ak").
The estimates and margins of error for Detailed Tables are grouped together by sequence numbers. There is an estimate and margin of error file for each sequence number.
The formats of the estimate and margin of error files are identical; they are strings of comma-delimited ASCII text. Each row represents a different geographic area and the first six fields contain metadata such as the geographic area and the sequence number.
Following those fields are the estimates or margins of error for the Detailed Tables. Starting and ending positions of the fields associated with each Detailed Table can be found using the Sequence Number and Table Number Lookup file, which is described in Section 3.
The estimates or margins of error for one Detailed Table span several fields within a row.
Table 2.6 shows the record layout of the estimates and the margin of error files:
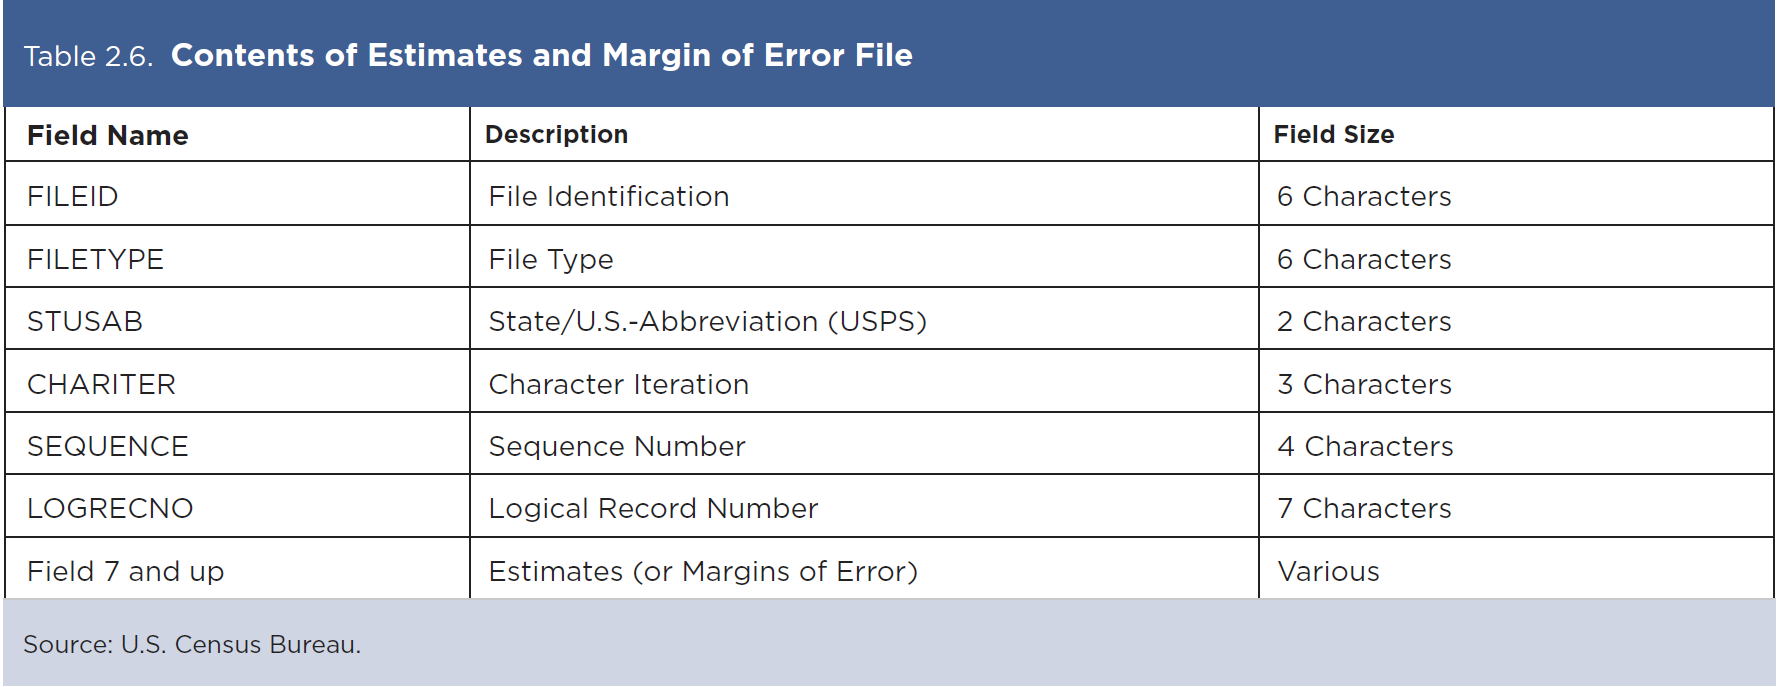
Figure 2.7 shows the first few rows from a 2017 ACS 1-year Summary File estimate file for the State of Maryland. The sequence number is "0038," which corresponds to Table B08406: "Sex of Workers by Means of Transportation to Work for Workplace Geography."
Data are shown for all geographies for the State of Maryland except census tracts and block groups. The logical record numbers corresponding to Maryland, Anne Arundel County, and Baltimore County are circled. The ACS estimates for these geographies can be found within their respective rows at field 7 and continuing for 50 additional fields.
With SAS or another statistical software program, you can use the logical record number (LOGRECNO) variable to merge the geography file with the estimate and margin of error files. An Excel-based tool can also be used. See Section 4 for more details.

The estimates and margins of error for Detailed Tables are grouped together by sequence numbers. There is an estimate and margin of error file for each sequence number.
The formats of the estimate and margin of error files are identical; they are strings of comma-delimited ASCII text. Each row represents a different geographic area and the first six fields contain metadata such as the geographic area and the sequence number.
Following those fields are the estimates or margins of error for the Detailed Tables. Starting and ending positions of the fields associated with each Detailed Table can be found using the Sequence Number and Table Number Lookup file, which is described in Section 3.
The estimates or margins of error for one Detailed Table span several fields within a row.
Table 2.6 shows the record layout of the estimates and the margin of error files:
Figure 2.7 shows the first few rows from a 2017 ACS 1-year Summary File estimate file for the State of Maryland. The sequence number is "0038," which corresponds to Table B08406: "Sex of Workers by Means of Transportation to Work for Workplace Geography."
Data are shown for all geographies for the State of Maryland except census tracts and block groups. The logical record numbers corresponding to Maryland, Anne Arundel County, and Baltimore County are circled. The ACS estimates for these geographies can be found within their respective rows at field 7 and continuing for 50 additional fields.
With SAS or another statistical software program, you can use the logical record number (LOGRECNO) variable to merge the geography file with the estimate and margin of error files. An Excel-based tool can also be used. See Section 4 for more details.
All American Community Survey (ACS) tables have a table ID that follows specific naming conventions. This makes it easy to identify the same table across different tools, such as in data.census.gov, the Summary File and the Application Programming Interface (API).
You will need to know the table ID in order to extract a table from the Summary File. Table IDs consist of up to five elements.
The first element is a letter that indicates the table type. For example, as shown in Figure 3.1, the first letter is “B” indicating that the data are from a Detailed (or Base) Table. Table IDs that start with "C" refer to collapsed tables. B tables have the most detail for a given topic while C tables have collapsed categories.
The next two characters identify the subject of the table. Tables beginning with "01," for example, are for tables in the age and sex subject. Each subject has a unique 2-digit subject number.

The following three digits are a sequential table number that uniquely identifies a table within a given subject.
The fourth element is an alphabetic suffix that indicates the corresponding ACS table is repeated for different race and Hispanic origin groups. For example, table IDs ending in a "C" are for American Indian and Alaska Native Alone populations. Those with an "H" suffix are for non-Hispanic White populations.
Lastly, selected tables will have a final alphabetic suffix "PR" to indicate a table is available for Puerto Rico geographies only.
Refer to the U.S. Census Bureau's Web site for more details about naming conventions and subject numbers for ACS tables.12
Footnotes:
12 U.S. Census Bureau, American Community Survey (ACS), Table IDs Explained, www.census.gov/programs-surveys/acs/guidance/which-data-tool/table-ids-explained.html.
You will need to know the table ID in order to extract a table from the Summary File. Table IDs consist of up to five elements.
The first element is a letter that indicates the table type. For example, as shown in Figure 3.1, the first letter is “B” indicating that the data are from a Detailed (or Base) Table. Table IDs that start with "C" refer to collapsed tables. B tables have the most detail for a given topic while C tables have collapsed categories.
The next two characters identify the subject of the table. Tables beginning with "01," for example, are for tables in the age and sex subject. Each subject has a unique 2-digit subject number.
The following three digits are a sequential table number that uniquely identifies a table within a given subject.
The fourth element is an alphabetic suffix that indicates the corresponding ACS table is repeated for different race and Hispanic origin groups. For example, table IDs ending in a "C" are for American Indian and Alaska Native Alone populations. Those with an "H" suffix are for non-Hispanic White populations.
Lastly, selected tables will have a final alphabetic suffix "PR" to indicate a table is available for Puerto Rico geographies only.
Refer to the U.S. Census Bureau's Web site for more details about naming conventions and subject numbers for ACS tables.12
Footnotes:
12 U.S. Census Bureau, American Community Survey (ACS), Table IDs Explained, www.census.gov/programs-surveys/acs/guidance/which-data-tool/table-ids-explained.html.
There are so many tables in the ACS that they cannot all fit into a single zipped file. The Detailed Tables are split across numerous files, called sequences. There are approximately 170 sequences for the ACS 1-year Summary File, and 120 sequences for the ACS 5-year Summary File. The rules governing how many tables can be assigned the same sequence number depend on the following:
There are no more than 256 cells per sequence, so the data can be read into a spreadsheet. There are 245 cells reserved for data and 11 other cells reserved for identifying information.
There are no more than 256 cells per sequence, so the data can be read into a spreadsheet. There are 245 cells reserved for data and 11 other cells reserved for identifying information.
- Tables are grouped numerically by the "root" of their Table ID, (for example, Table B00001 is in sequence file 0001).
- Tables with race iterations are grouped in the same sequence.
You need to know the sequence number associated with a Detailed Table to access the correct estimate and margin of error files for that table. The start position for the estimates or margins of error of a particular table depends on the sequence number.
To help data users find the sequence number associated with an ACS Detailed Table, the Census Bureau provides a Sequence Number/Table Number Lookup file with each ACS data release. The file is available in SAS, Excel, and text format and can be found on the Summary File Technical Documentation page.13 Use the SAS data set version when processing the Summary File data in SAS. Use the Excel version to view the list of tables, their associated table IDs, sequence numbers, and line numbers for ACS estimates within each table.
Suppose you are interested in obtaining data on transportation methods men and women use to get to work (Table B08406). To find the sequence number associated with the table, open and look for the appropriate table ID in the Sequence Number and Table Number Lookup file. Applying a filter and/or searching within the Excel file will ease this process. Figure 3.2 shows several of the rows for Table B08406. The sequence number associated with this table is "38." Therefore, to access the 2017 ACS 1-year estimates in Table B08406 for the nation as a whole, use the file labeled "e20171us0038000.txt." To access the corresponding margins of error for these estimates, use the file labeled "m20171us0038000.txt."

Footnotes:
13 U.S. Census Bureau, American Community Survey (ACS), Summary File Documentation, www.census.gov/programs-surveys/acs/technical-documentation/summary-file-documentation.html..
To help data users find the sequence number associated with an ACS Detailed Table, the Census Bureau provides a Sequence Number/Table Number Lookup file with each ACS data release. The file is available in SAS, Excel, and text format and can be found on the Summary File Technical Documentation page.13 Use the SAS data set version when processing the Summary File data in SAS. Use the Excel version to view the list of tables, their associated table IDs, sequence numbers, and line numbers for ACS estimates within each table.
Suppose you are interested in obtaining data on transportation methods men and women use to get to work (Table B08406). To find the sequence number associated with the table, open and look for the appropriate table ID in the Sequence Number and Table Number Lookup file. Applying a filter and/or searching within the Excel file will ease this process. Figure 3.2 shows several of the rows for Table B08406. The sequence number associated with this table is "38." Therefore, to access the 2017 ACS 1-year estimates in Table B08406 for the nation as a whole, use the file labeled "e20171us0038000.txt." To access the corresponding margins of error for these estimates, use the file labeled "m20171us0038000.txt."
Footnotes:
13 U.S. Census Bureau, American Community Survey (ACS), Summary File Documentation, www.census.gov/programs-surveys/acs/technical-documentation/summary-file-documentation.html..
In the ACS Summary File, variable names for estimates and margins of error are alpha-numeric.
Variable names include three elements: a table ID, a letter to indicate the data type (e=estimate, m=margin of error), and a line number, which identifies ACS estimates within each table. For example, in the SAS programs provided by the Census Bureau, the variable name for the estimated total number of people who are American Indian and Alaska Native alone is "B01001Ce1" (see Figure 3.3).

In the Excel file templates, the variable names are similar, except the "e" and "m" components have been removed because the estimates and margins of error are located in separate sheets. The line numbers in the Excel templates are preceded by an underscore ("_") and contain up to three digits, including leading zeros.
For example, the variable name for the estimated total number of people who are American Indian and Alaska Native alone is "B01001C_001."
You can use the information in the Lookup file to identify the variable names that will be used in the provided SAS programs and in the template files.
Variable names include three elements: a table ID, a letter to indicate the data type (e=estimate, m=margin of error), and a line number, which identifies ACS estimates within each table. For example, in the SAS programs provided by the Census Bureau, the variable name for the estimated total number of people who are American Indian and Alaska Native alone is "B01001Ce1" (see Figure 3.3).
In the Excel file templates, the variable names are similar, except the "e" and "m" components have been removed because the estimates and margins of error are located in separate sheets. The line numbers in the Excel templates are preceded by an underscore ("_") and contain up to three digits, including leading zeros.
For example, the variable name for the estimated total number of people who are American Indian and Alaska Native alone is "B01001C_001."
You can use the information in the Lookup file to identify the variable names that will be used in the provided SAS programs and in the template files.
The Summary File Excel Import Tool provides an option for retrieving tables from the American Community Survey (ACS) Summary File for data users without access to SAS or other statistical programming software. This tool is also useful if you are seeking data for just a few tables and/or geographies.
To use this tool, download the Summary File data, the appropriate template for importing the data, and the Simplified Geography File (described below).14 A guide titled "Instructions on How to Read the ACS Summary File into Excel" is available on the ACS Summary File Documentation Web page and walks you through each step to import the data into a spreadsheet.15
The Simplified Geography Files include basic information (LOGRECNO, GEOID, and name of geography) and are designed to be used with the Excel templates as outlined in the guide for reading the ACS Summary File into Excel. This Excel file contains a sheet for the United States, as well as each state or state equivalent. Compared to the standard geography files in .csv and .txt format, these simplified files contain only the geography variables needed to read the ACS Summary File into Excel. You can find the Simplified Geography Files on the ACS Summary File Documentation Web page.
Footnotes:
14 U.S. Census Bureau, American Community Survey (ACS) Summary File Data, www.census.gov/programs-surveys/acs/data/summary-file.html.
15 U.S. Census Bureau, American Community Survey (ACS) Summary File Documentation, www.census.gov/programs-surveys/acs/technical-documentation/summary-file-documentation.html.
There are two programming options for SAS users. The first option is a set of individual SAS programs, one for each Summary File by geography, sequence, and file type (estimate or margin of error). These programs are best for users only interested in looking at a specific sequence for a specific geography. The individual SAS programs provide code for reading in each sequence into SAS, labeling variables, and saving the table as a SAS data set. However, you need to produce your own code to merge the geography, estimation, and margin of error files together.
The second option is a single SAS program that is parameterized to allow users to read the entire Summary File into SAS. This program includes a series of macros and is designed for advanced users who need a large quantity of data. You can access these programs, as well as an example SAS program, on the Summary File Documentation Web page.16
Footnotes:
16 U.S. Census Bureau, American Community Survey (ACS) Summary File Documentation, www.census.gov/programs-surveys/acs/technical-documentation/summary-file-documentation.html.
Footnotes:
16 U.S. Census Bureau, American Community Survey (ACS) Summary File Documentation, www.census.gov/programs-surveys/acs/technical-documentation/summary-file-documentation.html.
The U.S. Census Bureau produces a series of appendix tables for data users who want more information about ACS Detailed Tables and the types of geographies that are available. The 1-year and 5-year appendixes can be downloaded as Excel files from the Summary File Documentation page.17 Each file contains a separate sheet for Appendix A and Appendix B.
Appendix A lists all the Detailed Tables included in the ACS Summary File, along with their associated sequence numbers. This appendix also includes information on geography restrictions for each table. For data quality and geographic reasons, some tables are published with specific geography restrictions. For example, Table B05001PR, "Citizenship Status in Puerto Rico," is produced for Puerto Rico only, and Table B08501, "Means of Transportation to Work by Age for Workplace Geography," is only produced for the workplace geographies.
The Topics column in the Appendix A sheet includes the ACS data topics covered, such as Age and Sex, Commuting, and School Enrollment; while the Universe column describes the total number of units in the population of interest, such as total population, housing units, or workers 16 years and over.
Appendix B contains a list of the summary levels and components for each geography that is included in the ACS Detailed Tables.
Footnotes:
17 U.S. Census Bureau, American Community Survey (ACS) Summary File Documentation, www.census.gov/programs-surveys/acs/technical-documentation/summary-file-documentation.html.
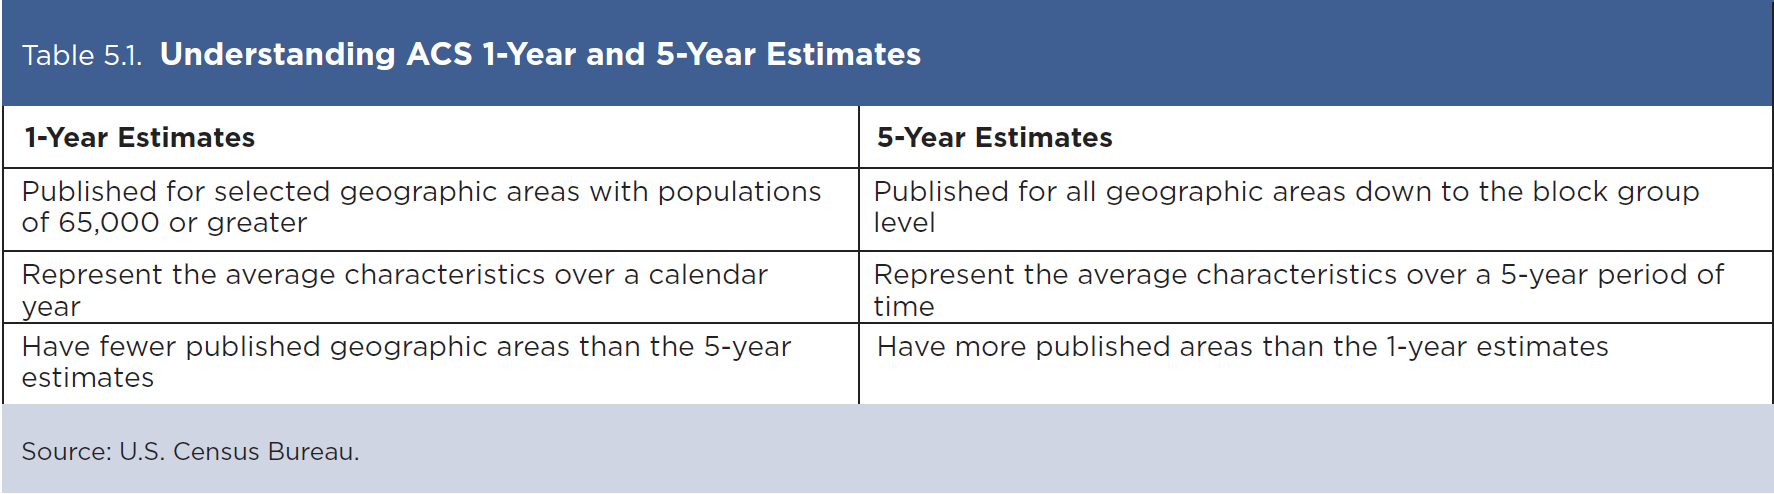
The U.S. Census Bureau publishes American Community Survey (ACS) 1-year and 5-year estimates, with population thresholds set for the ACS 1-year estimates to provide reliable data. Table 5.1 provides a brief comparison of the two types of estimates:
For more guidance on using ACS 1-year and 5-year estimates, see the Chapter on "Understanding Multiyear Estimates" in Understanding and Using American Community Survey Data: What All Data Users Need to Know.18
Footnotes:
18 U.S. Census Bureau, Understanding and Using American Community Survey Data: What All Data Users Need to Know, www.census.gov/programs-surveys/acs/guidance/handbooks/general.html.
Data users often question why certain ACS estimates are not available. Missing estimates can be caused by data suppression through various methods or restrictions that are applied to ACS data to limit the disclosure of information about individual respondents and the number of published estimates with unacceptable statistical reliability.
Filtering rules, based on statistical reliability of the ACS 1-year estimates, are used to ensure that Detailed Tables are not released where the majority of estimates in the Detailed Tables have an unacceptable level of reliability.
Learn more about missing estimates and filtering rules on the Census Bureau's Data Suppression Web page.19
Footnotes:
19 U.S. Census Bureau, American Community Survey (ACS), Data Suppression, www.census.gov/programs-surveys/acs/technical-documentation/data-suppression.html.
Tables B00001, B00002, B98001, and B98002 are sample counts, not estimates, and do not have margins of error associated with them. Tables in series B99 imputation tables and B98 (except B98001 and B98002) quality measure tables do not provide margin of error calculations. The margin of error calculations are set to "-1" for these tables.
There are a few special rules on how certain margins of error are determined for ACS estimates. The accuracy of the estimate (decimal place) within the Detailed Tables determines to how many digits the margin of error is rounded.
There are a few special rules on how certain margins of error are determined for ACS estimates. The accuracy of the estimate (decimal place) within the Detailed Tables determines to how many digits the margin of error is rounded.
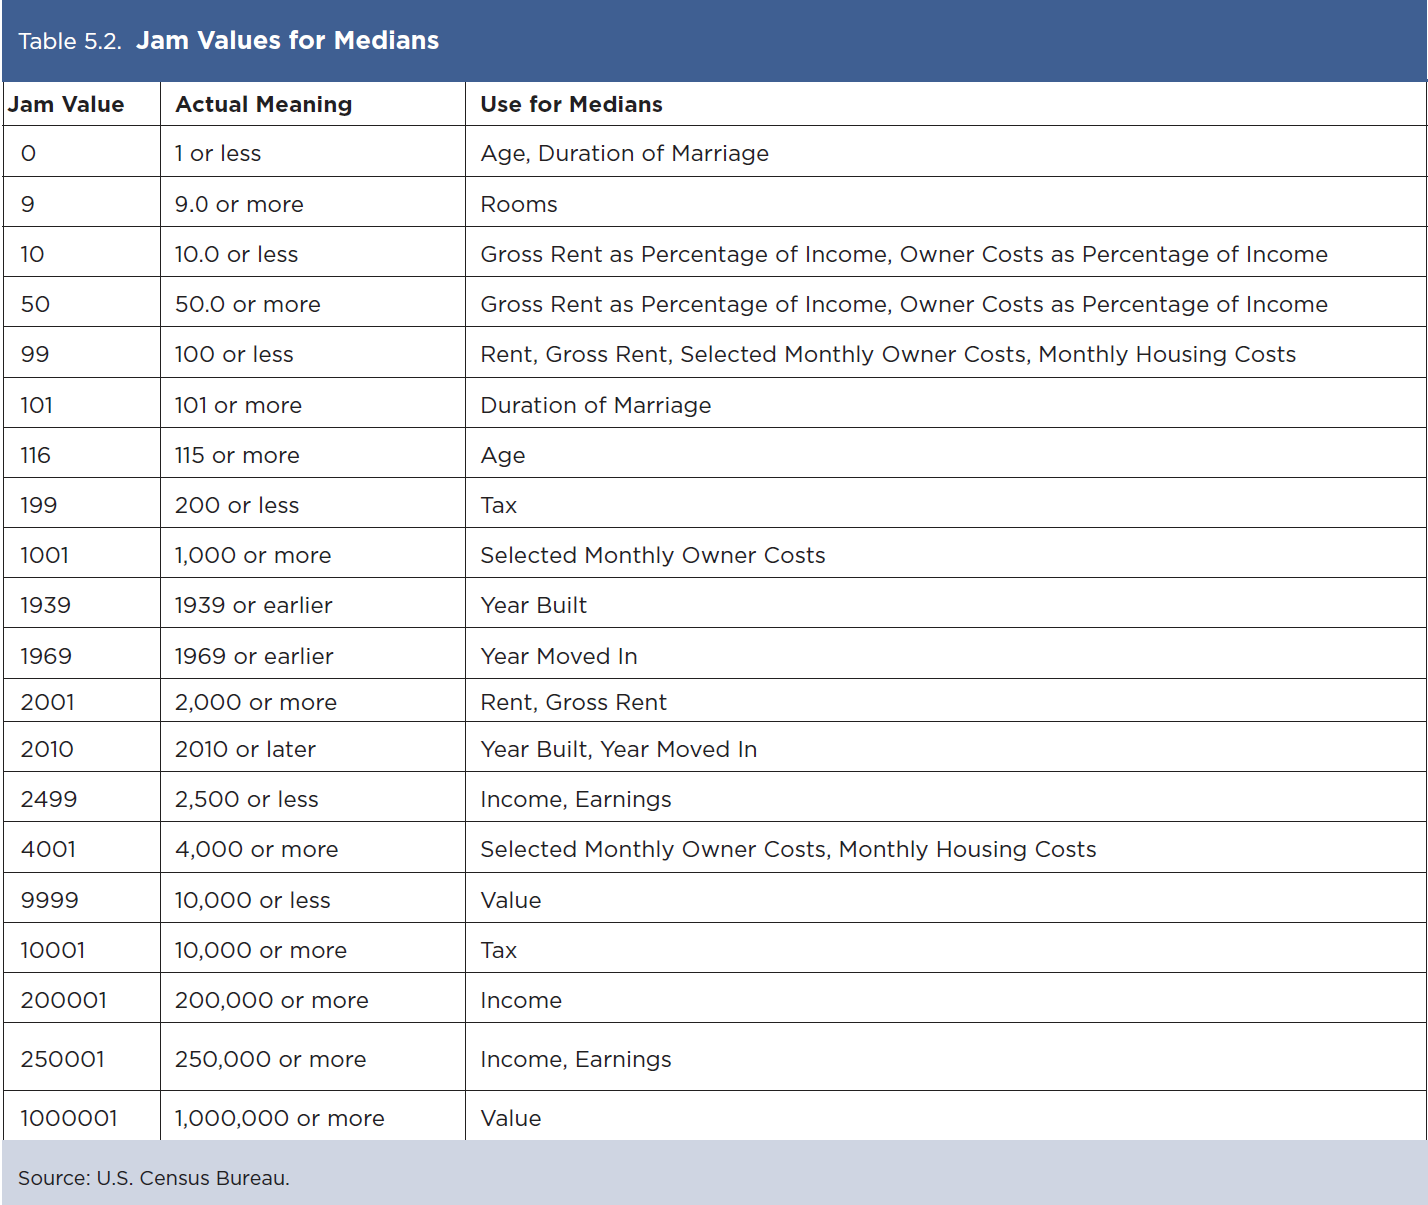
Some data values represent unique situations where either the information to be conveyed is an explanation for the absence of data, represented by a symbol in the data display, such as "(X)," or the information to be conveyed is an open-ended distribution, such as "115 or greater," represented by 115+. These are the socalled "jam values."
The following special data values can appear in an ACS Summary File table as an explanation for the absence of data:
The following special data values can appear in an ACS Summary File table as an explanation for the absence of data:
- Missing Value = ""
A missing string indicates that the estimate is unavailable. This value appears in the estimate and margin of error files as two commas adjacent to each other without any characters between them. A missing value indicates an estimate is missing because of geographic restrictions, unacceptable statistical reliability, or the Census Bureau's Disclosure Review Board requirements. If the last cell in a data file is filtered, then there will be a comma followed immediately by a carriage return or end-of-file (EOF) indication. - Dot = "."
A dot indicates that the estimate has no sample observations or too few sample observations. In the margin of error files, this value could also indicate that the margin of error is unavailable for a median estimate that has been replaced with a jam value. - Zero = "0"
A "0" entry in the margin of error column indicates that the estimate is controlled. This is similar to the "*****" symbol used in data.census.gov. - Negative 1 = "-1"
This indicates that an estimate does not contain a margin of error. Tables B00001 and B00002 and tables starting with B98 and B99 do not have margins of error associated with them. - Jam Values for Medians
Table 5.2 lists the jam values for medians. For example, a dollar amount is not calculated for Table B10010 if the estimate is 2,500 or less.
The estimates in the Summary File are stored using standard notation instead of in scientific notation. The estimates are stored as whole numbers. The largest estimate in the ACS Summary File contains 14 digits.
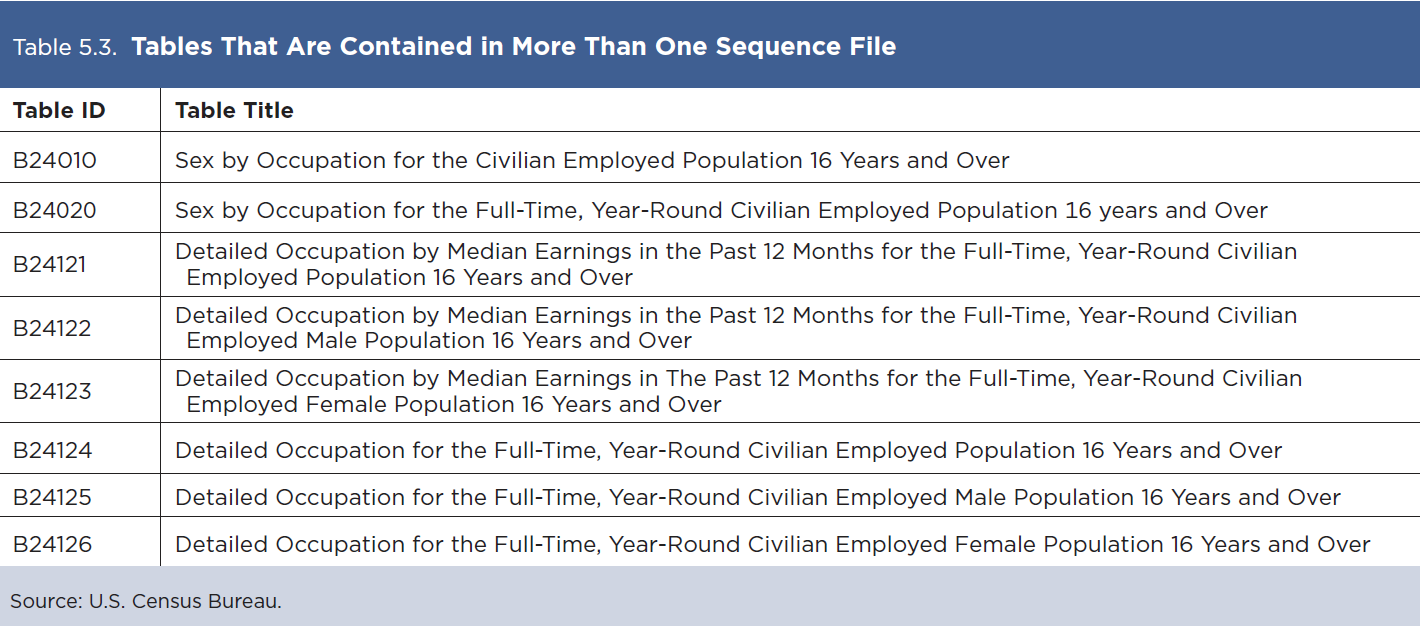
There are eight tables with more than the maximum 245 cells that cannot fit into a single sequence, so each of these tables is divided into multiple sequence files. Table 5.3 shows the tables that contain multiple sequences.
Check Appendix A of the 1-year Appendixes or 5-year Appendixes Excel files to verify the sequences for these tables.20 The last six tables on the list are only produced at the national level (summary level 010), and the files for these sequences will be blank for all other summary levels.
Footnotes:
20 U.S. Census Bureau, American Community Survey (ACS) Summary File Documentation, www.census.gov/programs-surveys/acs/technical-documentation/summary-file-documentation.html.
Please send any technical questions or comments you have on the ACS Summary File via e-mail to: acso.users.support@census.gov. If you have questions or comments about the ACS, you can submit a question online at https://ask.census.gov/.

