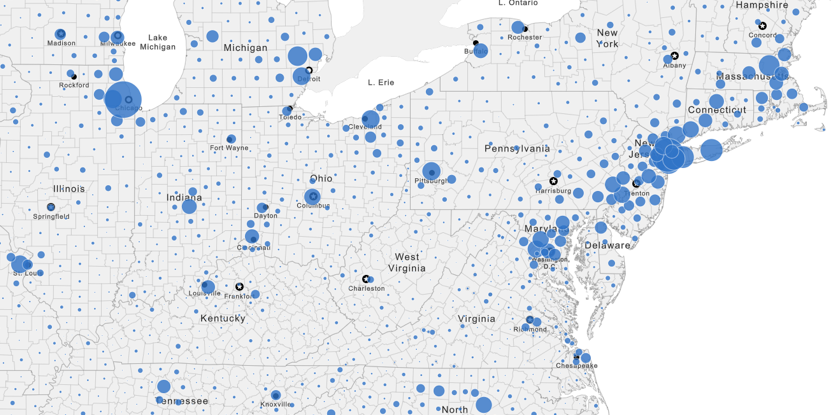
Explore over 500,000 data indicators and over 220 years of data for the United States from present to 1790, including all Decennial Censuses, American Community Surveys and many other datasets.

This unique dataset gives you a chance to explore and compare decennial census data from 1970 to 2000 on 2010 geography. This dataset makes it easy to track demographic changes in the United States during last 40 years. Data is available on census tract, county, state and nation level.
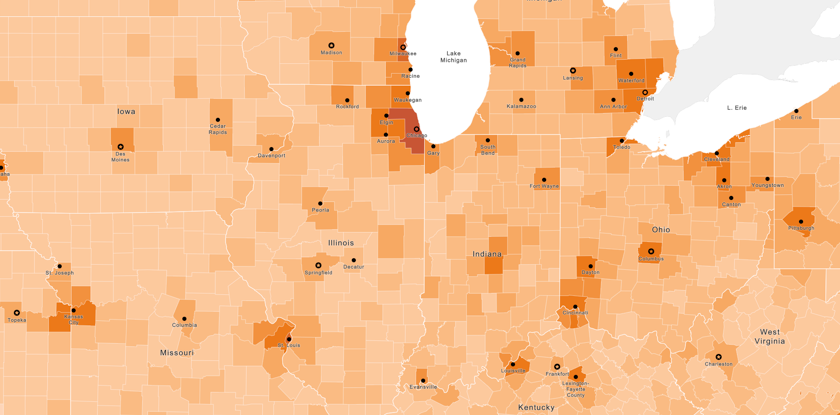
Visualize U.S. crime data on a metropolitan/nonmetropolitan county level starting from 2010. The crime data originates from FBI and UCR. Data are available for different types of crime and arrests, including violent crimes and murders, followed by the property crimes such as burglaries and larceny-thefts.
Explore vital health factors such as access to health care, obesity, smoking, excessive drinking and others in nearly every county in United States. The presented data comes from the County Health Rankings & Roadmaps program.
This daily updated dataset allows you to explore and visualize COVID-19 data across the United States at the state, county, and MSA levels. Track the cumulative number of confirmed cases and deaths, the growth rate of the virus, the number of negative and positive tests, and much more on one convenient map. With daily updates and data provided by the New York Times and The Covid Tracking Project, receive reliable and accurate data every day with this new dataset.
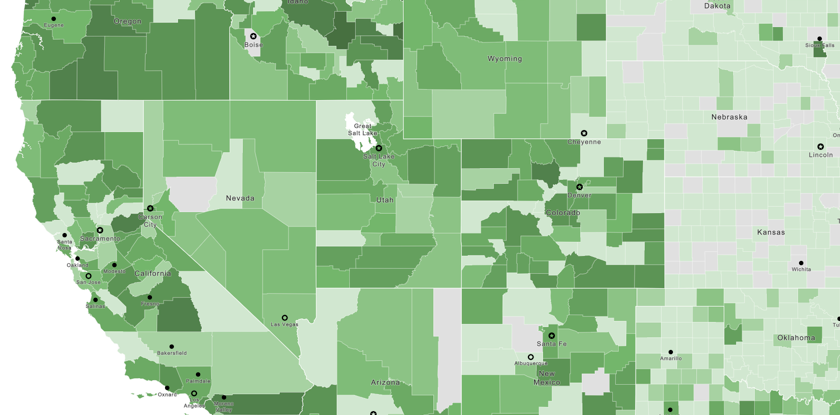
Visualize the Population Estimates for U.S. on state and county levels for the latest vintage year. The annual time series of estimates begins with the most recent decennial census data and extends to the vintage year. It contains the components of population change (births, deaths, and migration).
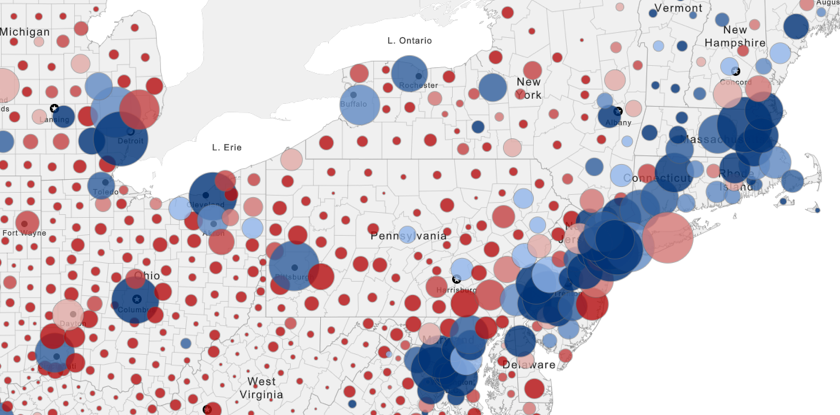
Visualize United States election results historically from 1912 to today. Presidential, senatorial, congressional and gubernatorial election data comes from Dave Leip's Atlas of U.S. Presidential Elections and is available for map presentation only.
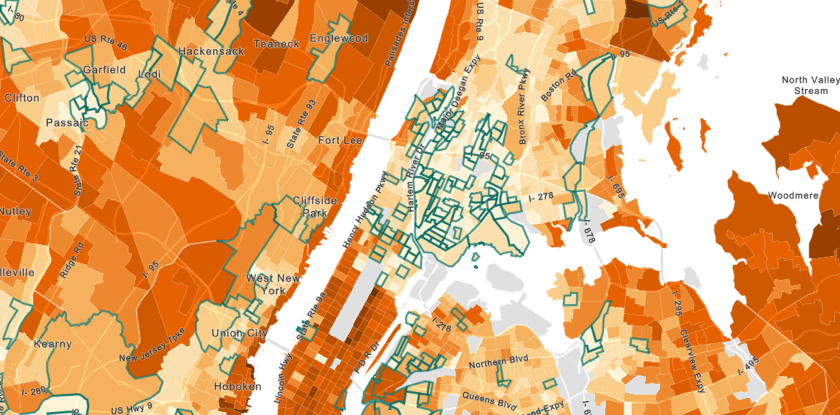
The Opportunity Zones incentive is a new community investment tool established by Congress to encourage long-term investment in low-income communities.Explore the U.S. data with Opportunity zones layer, and create Opportunity Zone Report including the most important demographics on population density, race, age, income, education, family and households.
Visually explore 2001, 2006 and 2011 land cover summaries computed by National Historical Geographic Information System and Social Explorer on 2015 states, counties and census tracts.
Visualize annual statistics on U.S. businesses with and without paid employees or payroll at detailed levels of geography and industry. Statistics are available on business establishments at the state and county levels, metropolitan area, ZIP code levels, and congressional districts.
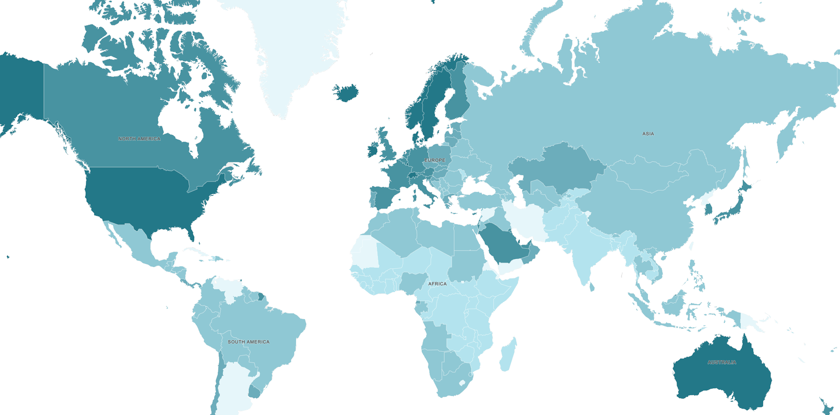
World Development Indicators, collected by The World Bank, are bringing the world to Social Explorer maps. You can now visualize, explore and compare indicators for almost every world country or switch to geographic region level for summarized preview. Data is available in decennial reports (1960-2013).
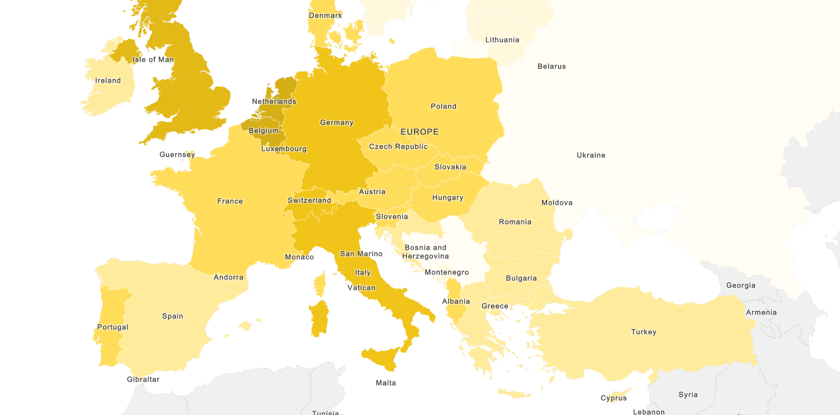
Visualize European Statistics (Eurostat) demography and migration data on a country and disseminated geographical aggregates levels. Available data cover population and its characteristics as well as vital events (births, deaths) and migration
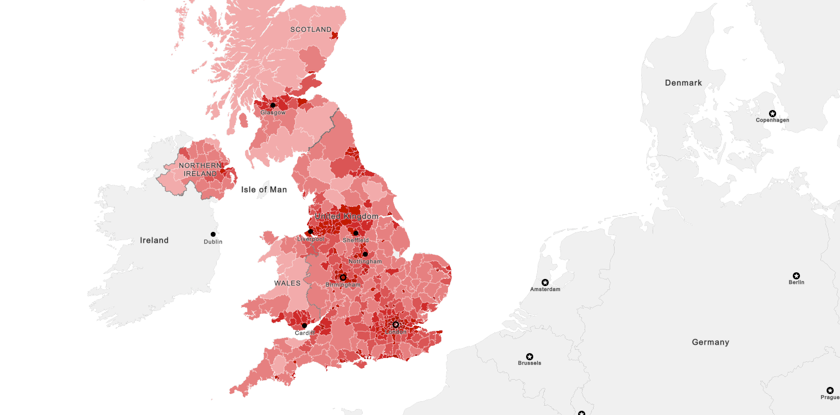
The combined United Kingdom Census 2011 data for England, Wales, Scotland and Northern Ireland is available for Key and Quick Statistics as well as the Social Explorer data set. This covers population, people and places, health and social care, travel and transport, qualifications and labour market, living arrangements, household composition, and accommodation type.
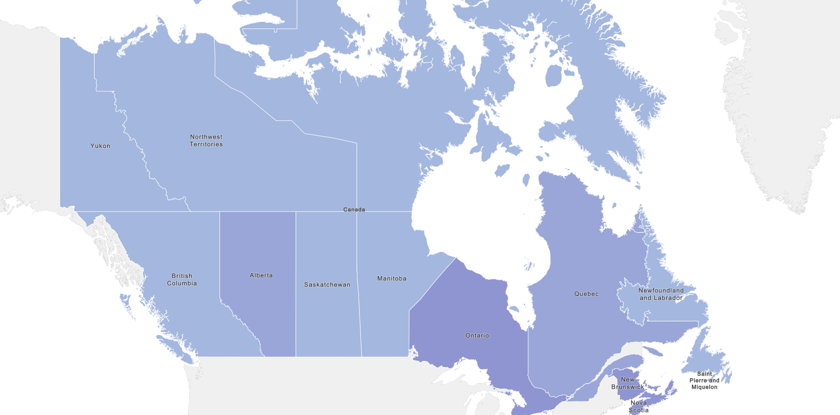
Explore the 2011 Canadian Census of Population and National Household Survey data. Data cover topics such as age, sex, families, household and marital status, dwelling, income, education, labor, immigration and other data.
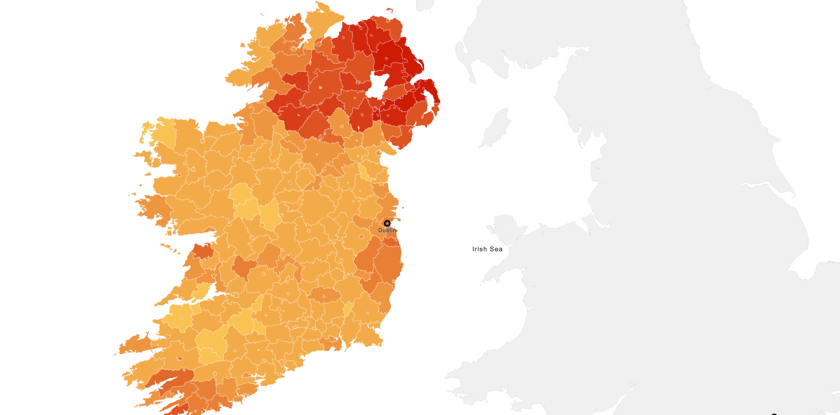
Explore Irish religion and population data from 1911 to 2001 through decades of political change. These data and geographies were compiled by Professor Ian Gregory of Lancaster University, from Religious change in twentieth century Ireland: A spatial history.