
Always talking about the weather? This summer, put the power of data behind "heated" conversations and research with Social Explorer. We have a variety of datasets to help analyze heat wave patterns and impact around the nation.
The National Oceanic and Atmospheric Administration (NOAA) Climate Normals dataset offers detailed weather observations across the country. Social Explorer has NOAA data for 2020 Climate Normals for both the 15-year period (2006 to 2020) and 30-year period (1991 to 2020). With practical applications for climate comparisons, energy use, agricultural planning, and more, Social Explorer’s NOAA data adds heat to your inquiries.
NOAA data includes detailed numbers on long-term averages of annual “Cooling Degree Days” (CDDs). Using 65F degrees as the standard, any average daily temperature in excess of 65F contributes to the count. So if the average temperature on a given day is 85°F, that single day contributes 20 CDDs (85 - 65 = 20). If the next day averages 90°F, it contributes 25 CDDs. Those accumulate across every day of the year. For example, Phoenix, AZ, has over 150 days per year where average temperatures exceed 85°F. A summer month alone might contribute 600 to 800 CDDs. Add up all 12 months and you easily reach 4,000–5,000 CDDs annually.
The following map of Climate Normals Average Cooling Degree Days shows the county and regional trends of excessive temperatures.
Puerto Rico and South Florida sit at the extreme top of the distribution. Puerto Rico municipios regularly exceed 5,000 to 6,000 CDD because temperatures rarely dip below 65°F even at night, meaning heat accumulates 365 days a year. South Florida (Monroe, Miami-Dade, Broward) mirrors this tropical climate pattern.
While home to some of the hottest counties (such as Yuma), much of the Arizona and New Mexico region is less extreme in terms of CDDs because of high elevation areas with cooler temperatures. We see variation in California as well with coastal counties enjoying cooler temperatures while inland areas, such as Inyo County, bear more extreme heat.
Zoom in on the map to explore more regional temperature trends.
The overall cooling needs for a given area tell just one part of the story. Social Explorer offers diverse datasets to help add context and flag areas for concern or further examination. Federal Emergency Management Agency (FEMA) data includes details about extreme heat event occurrences. Social Explorer has FEMA’s National Risk Index (2021) available in our data library. This dataset helps identify the risks and impacts of 18 different natural hazards, from earthquakes to hurricanes to landslides to heat waves and more.
“Annualized Frequency” is FEMA's estimate of how many heat wave events are expected to occur per year at a given location, based on the historical record. Zooming in on the Midwest and Oklahoma, we see counties with a noticeably higher frequency of heat waves.
Adding Social Explorer’s Social Vulnerability Index (SVI) to our analysis also helps flag the communities most at risk when a heat wave occurs. Developed by the Centers for Disease Control and Prevention and the Agency for Toxic Substances and Disease Registry, the SVI measures the resilience of communities when confronted by external stresses on human health. SVI indices factor in socioeconomic status, household characteristics, racial and ethnic minority status, and housing type and transportation.
Only six counties nationally clear the threshold of meaningful combined concern — meaning they have both a heat wave Expected Annual Loss Score of 50 or above (out of 100) and an SVI percentile of 0.75 or above (top quartile of vulnerability). Expected Annual Loss is FEMA's estimate of the average economic damage a specific natural hazard is expected to cause in a given area each year, expressed in dollars. The FEMA calculation includes building values, population equivalence (injuries and deaths using standard federal valuation methods), and agricultural value.
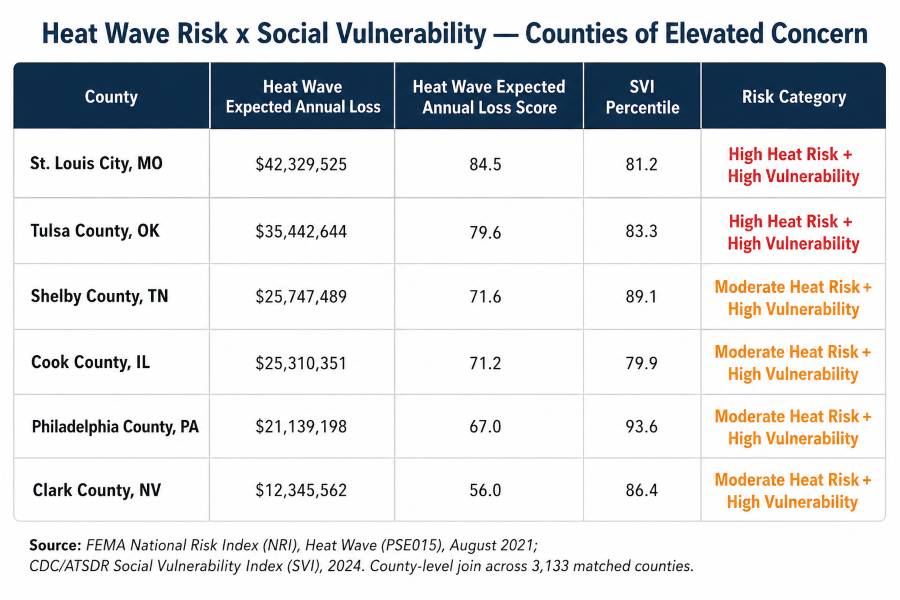
Heat wave risk is concentrated in the interior Midwest and South (Missouri, Oklahoma, Tennessee, Illinois) where extreme heat events are frequent and building stock is heavily exposed. These are not the hottest states by temperature, but they have the highest annualized economic losses from heat because of the combination of frequency, population density, and building exposure.
Discover More of Social Explorer’s Heat, Hazard and Demographic Data
Social Explorer lets you quickly bring together data from NOAA, FEMA and SVI to examine heat waves without breaking a sweat. Check out more of Social Explorer’s data library to analyze heat waves and the communities most affected further, from the American Community Survey to additional environmental datasets and so much more. Enhance your research, planning, grant-writing, and other investigations.
Subscribers can get started or sign up for a free Social Explorer account to try it out today.