Change data menu
We’ve made significant changes to the Social Explorer app, keeping in mind better organization and greater ease of use. Introducing the Change data menu, located on the left-hand side of our updated interface. Map title, data selection, more options menu, geography level, visualization type, data dictionary, and citation tool are now all grouped together in the Change data menu.
You can take a short on-screen tour to learn about where to find all of your favorite features and tools on our updated interface. Click on the More button on the map header and select Take a tour to start the tour.
Browsing data
Our updated interface now shows all the available categories in the Categories tab (formerly known as Browse by Category). We have listed all the unavailable categories right below the category picker and added the years in which each category is available for your reference.
- In the main map menu, click Change data.
- In the top slider, select the year you're interested in.
- Click the category you're interested in.
- Scroll to the survey you're interested in and click the variable you want to visualize on the map, or type in the name of the variable in the search bar.
You can also browse data by survey in the All data tab. Not much has changed here – simply select the survey, dataset, and table to browse all available data. Or, browse data by your Saved variables. We placed the Saved variables tab right in the Change data menu for easier access and more intuitive selection. When viewing variables, save them in the Saved variables by clicking on the star icon and effortlessly switch between the variables.
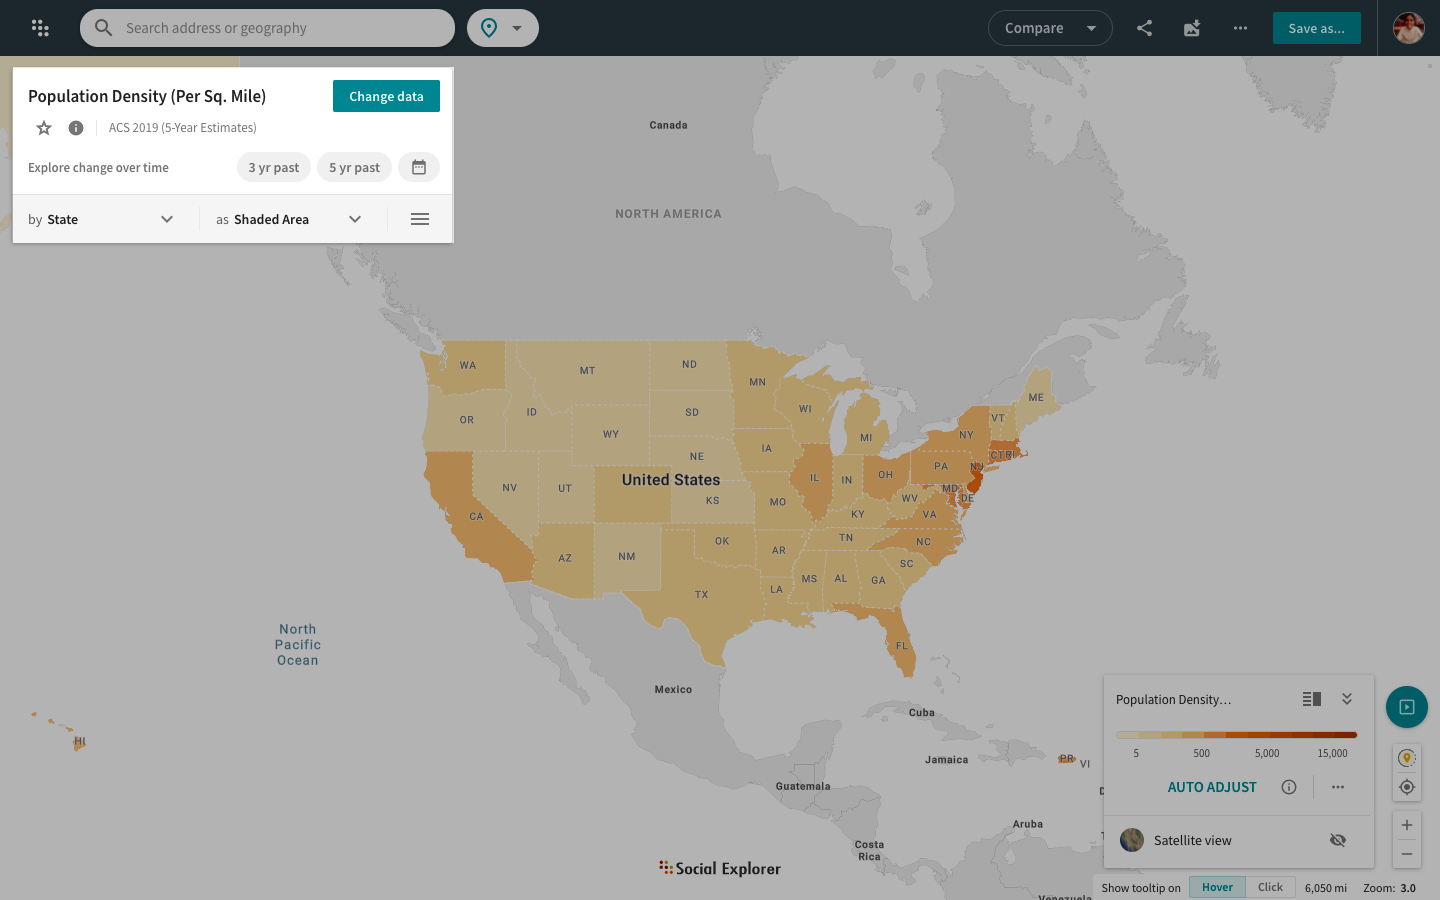
By default, the data selector displays the latest ACS 5-Year Population Density estimate.
View data dictionary
Click on the More info icon ![]() in the Change data menu to learn more about the mapped variable and then click on Open Data Dictionary to get all the details.
in the Change data menu to learn more about the mapped variable and then click on Open Data Dictionary to get all the details.
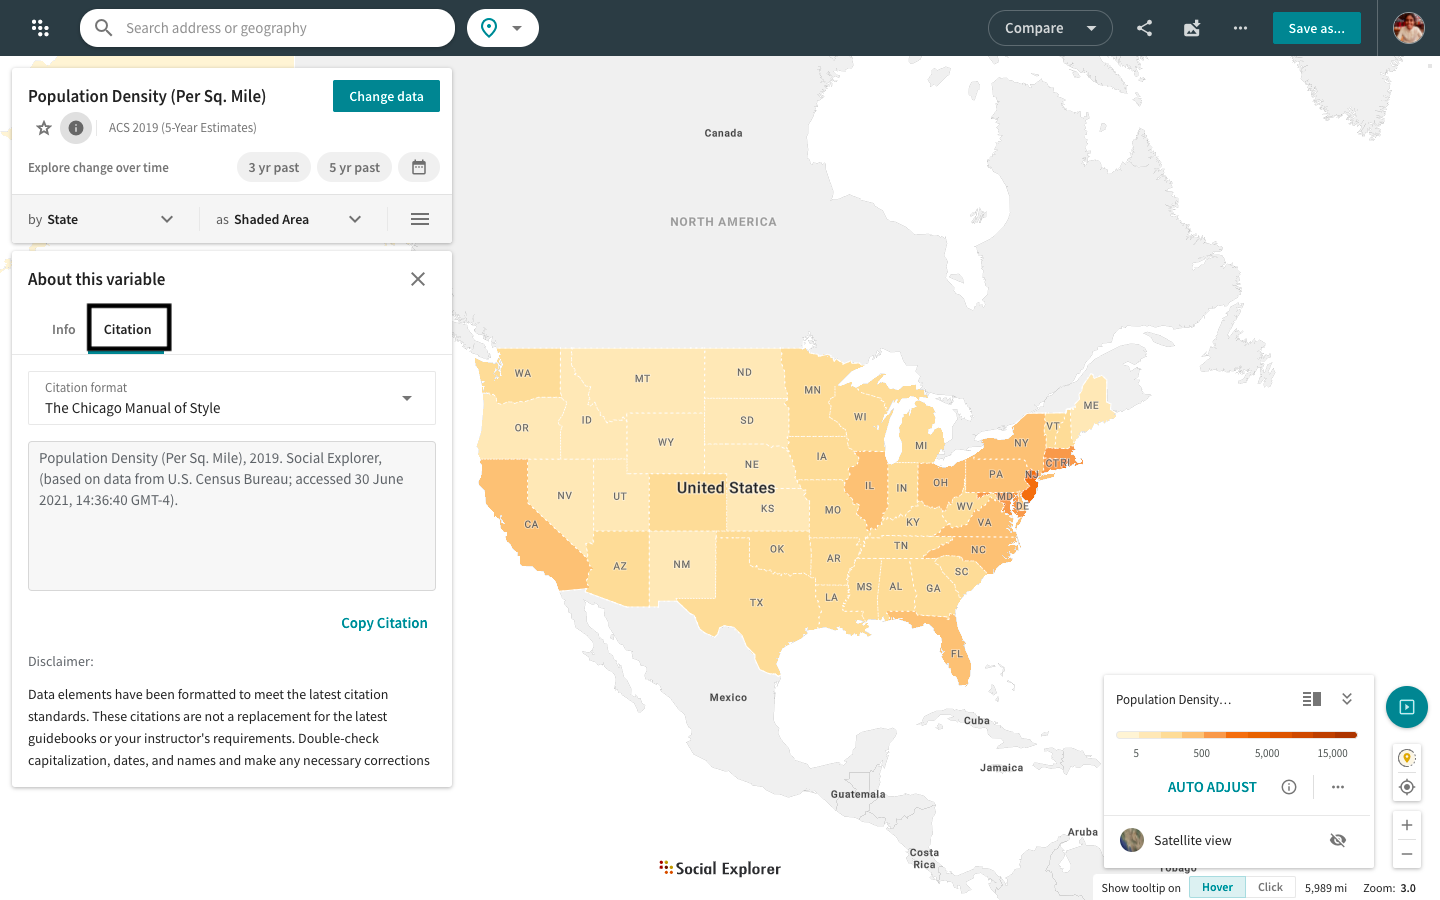
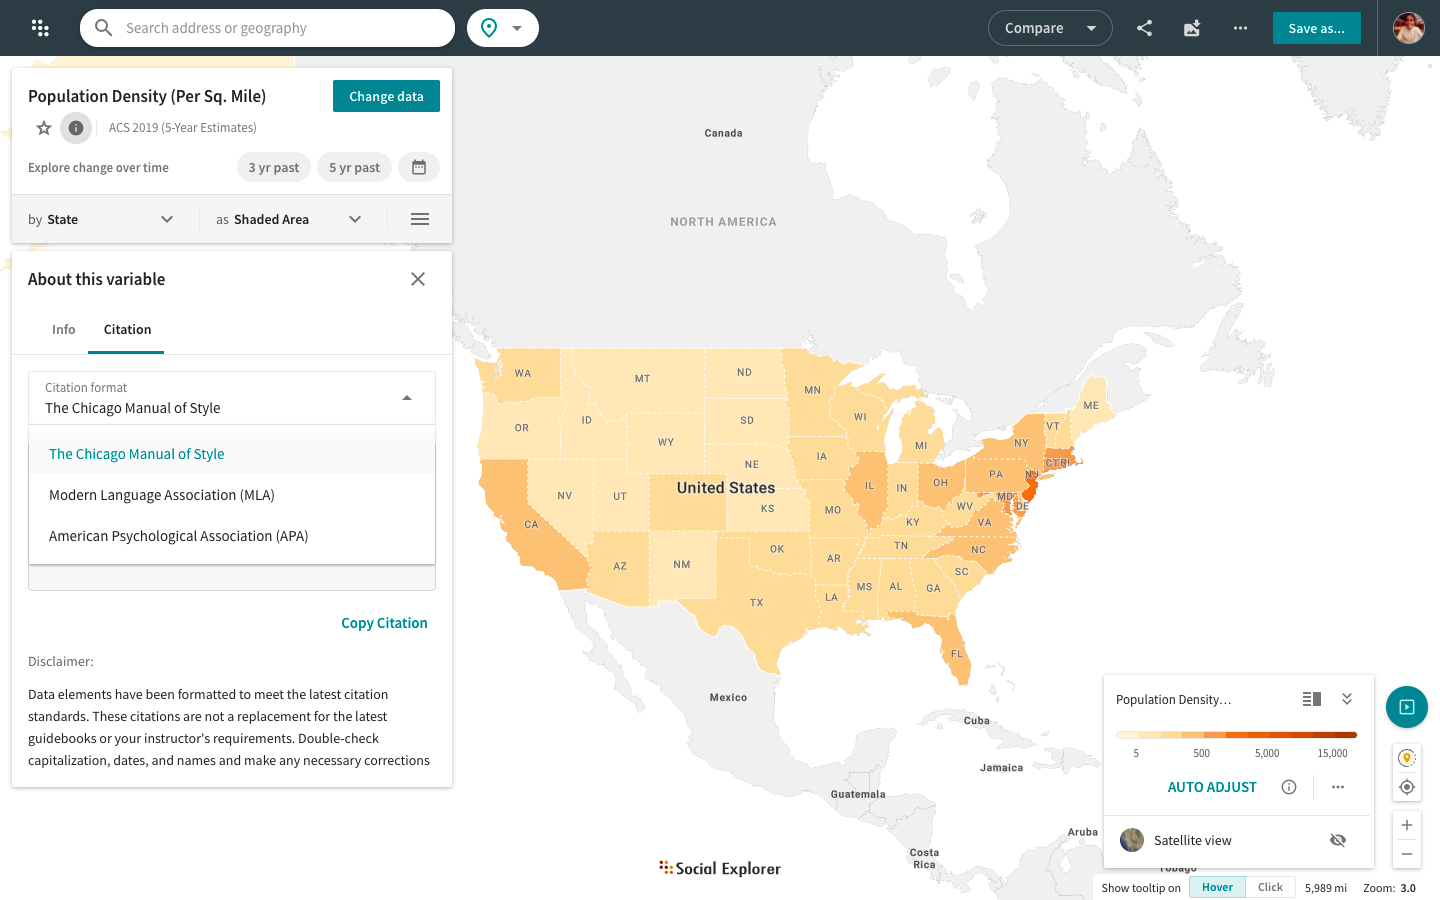
Citation tool
When referencing Social Explorer maps or reports in your academic papers, simply use our new citation tool to automatically generate citations in three available formats.
Click on the More info icon ![]() in the Change data menu and select the Citation tab, which allows you to copy citations in the following formats:
in the Change data menu and select the Citation tab, which allows you to copy citations in the following formats:
- The Chicago Manual of Style
- Modern Language Association (MLA)
- American Psychological Association (APA)
Change over time
Our new Change over time feature allows you to map patterns in demographic and socioeconomic change over a period of time at varying levels of geography.
Click Change year in the Change data menu and then select Change over time to start exploring. You can also simply switch the map view from one year to another for the same variable by selecting those years from the Single year option.
To view change over a 3-year or 5-year period of time for a particular data variable, you can now select the options directly from the Change data menu. Click on the 3 year period or 5 year period options to do so. Click on X to turn off the selected option.
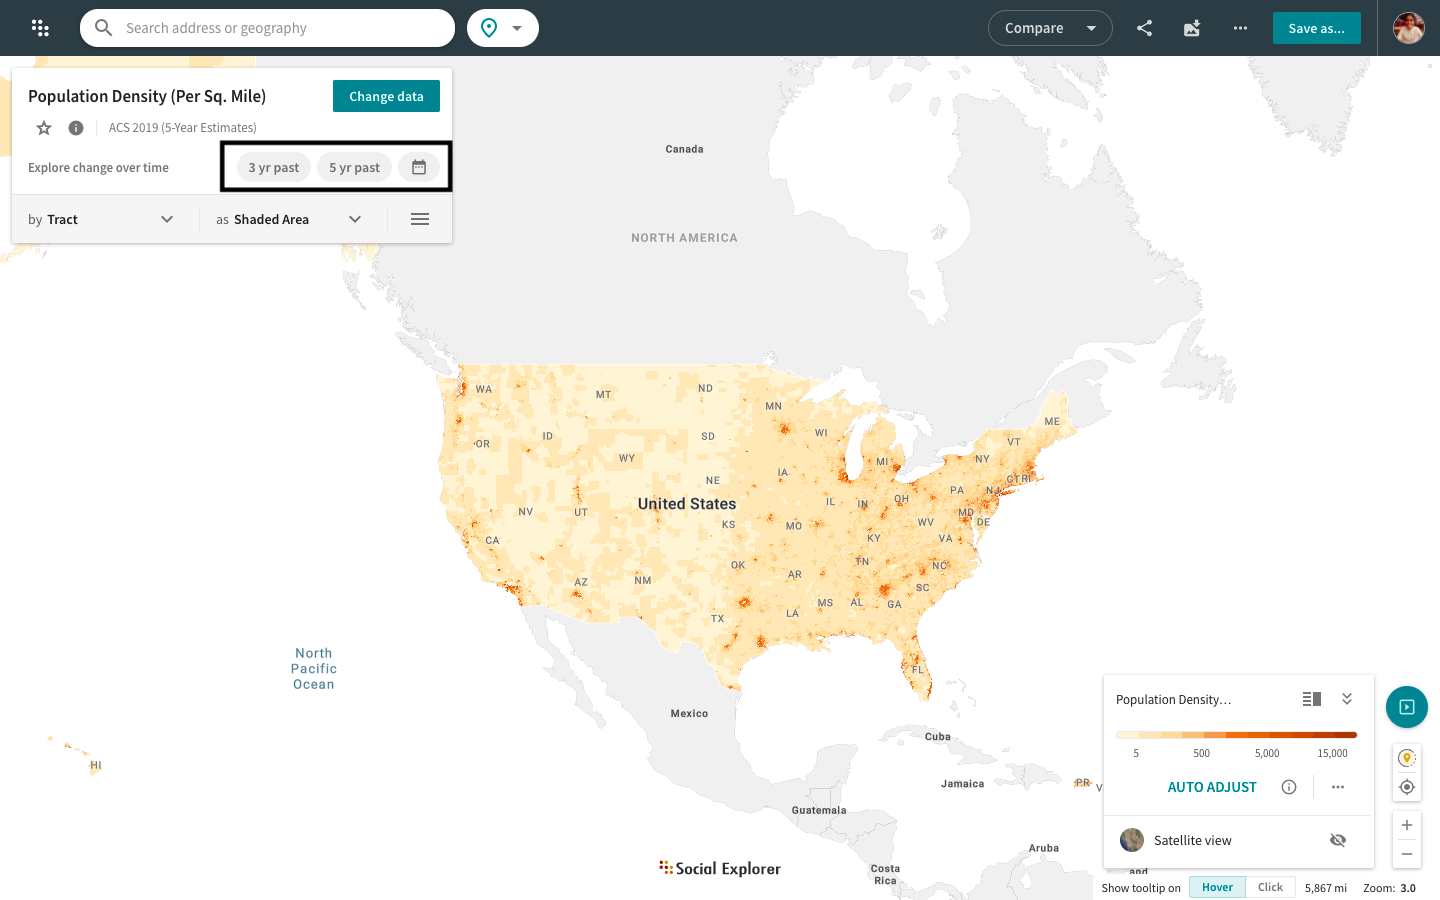
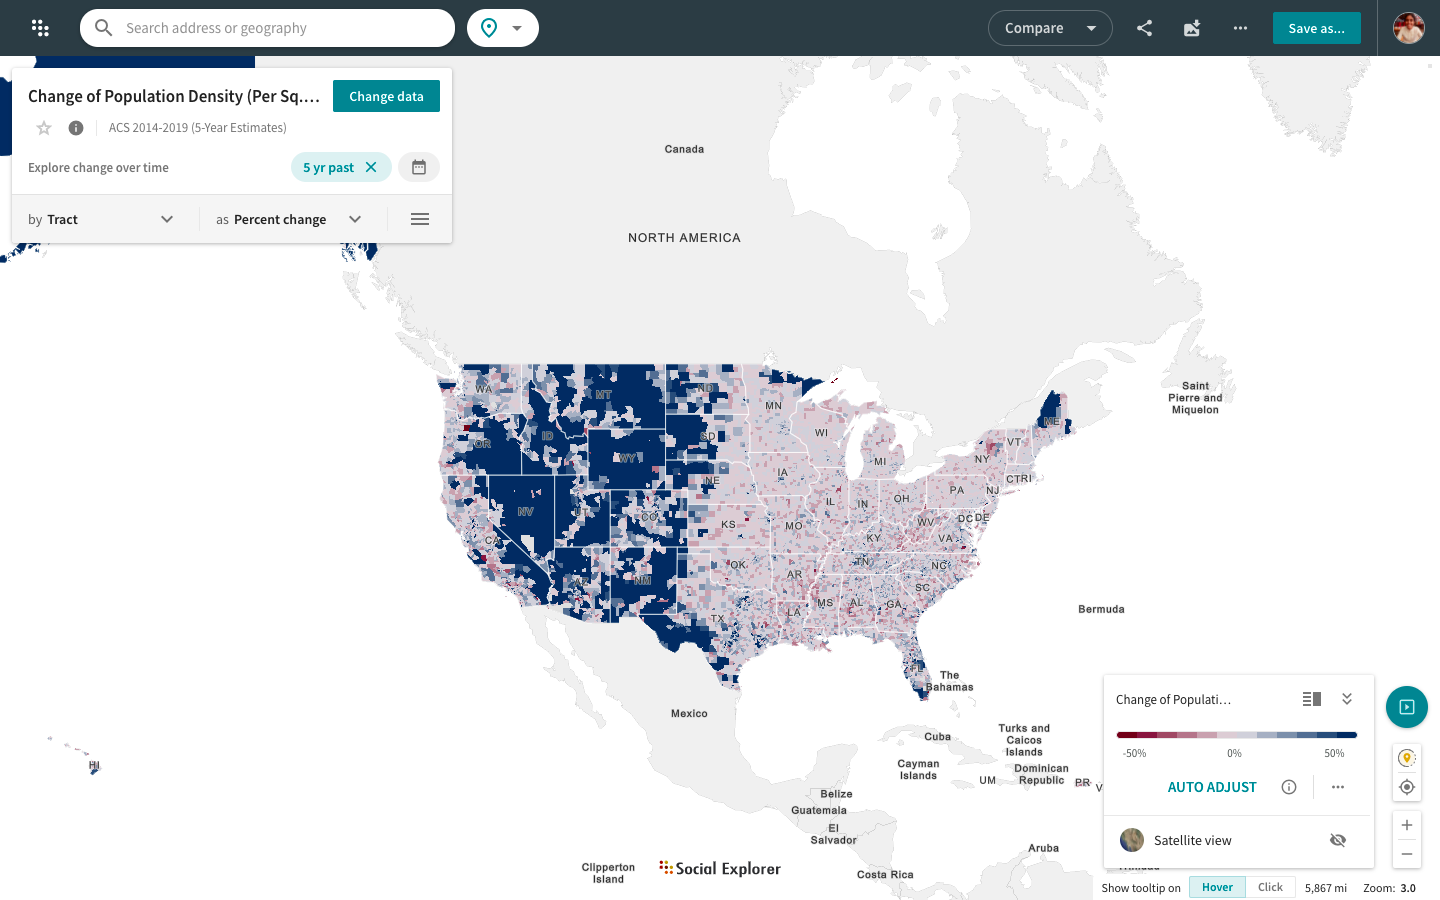
Discover trends or changes over time by visualizing the difference in values for the same variable between two different years. Currently, this feature is available only for the ACS 5-Year Estimates from 2010 to 2019 (both Social Explorer tables and original ACS tables). Click here to learn more.
Adjust $ values for inflation in maps
You can now adjust dollar amounts for inflation directly in Social Explorer maps. This feature allows you to easily compare money-related data, such as income, median home value, and gross rent, from different years.
Click the icon for CPI Correction in the Change data menu.
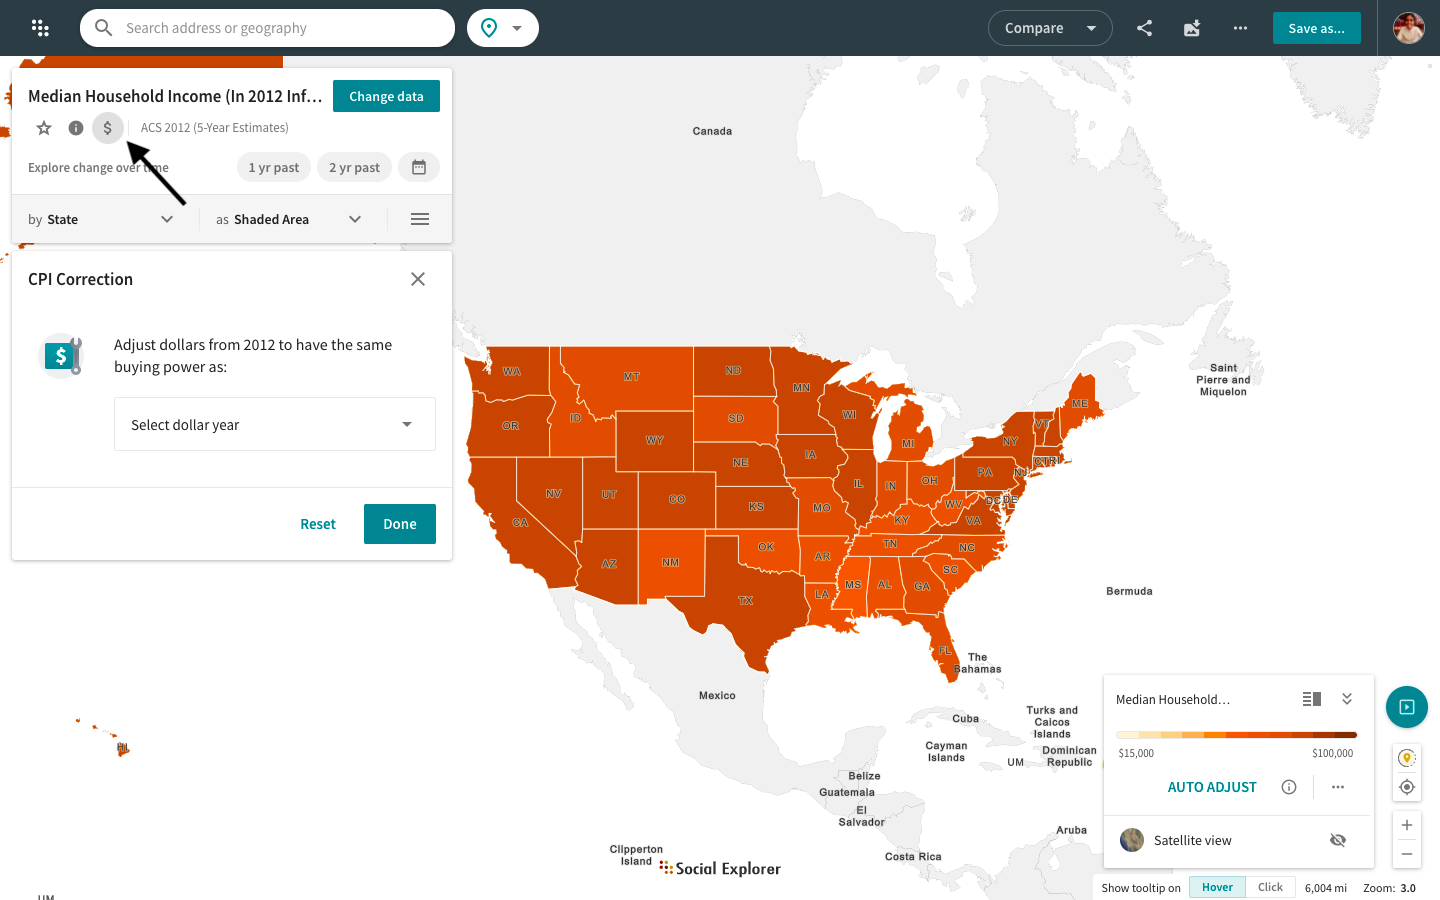
Learn how to adjust dollar amounts for inflation with this guide.
Change percent base of categorical variables
For some data selections, you can now adjust the percent base from the default total population to other possible subsets. This feature is particularly useful for mapping the percentage of certain categorical variables against a smaller base.
For example, if you’d like to calculate the percentage of African Americans among only the non-Hispanic or Latino population, or the percentage of the total population in the armed forces among the total labor force.
Click the percentage icon in the Change data menu to change the variable percent base.
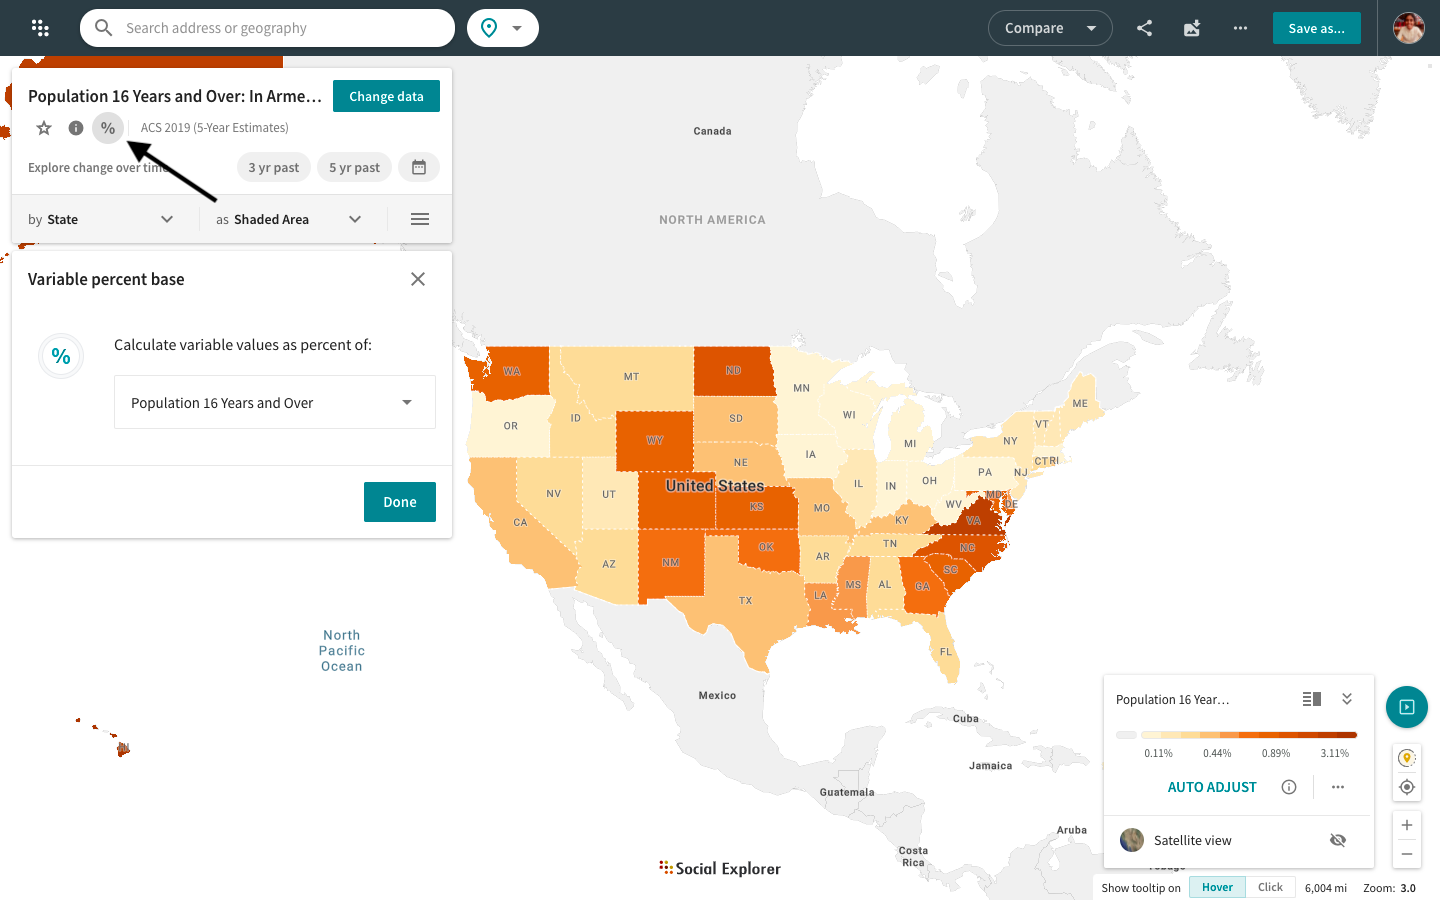
To learn more about how to change the variable percent base from the default to a smaller subset, click here.
Map options menu
We have streamlined the More options menu and moved it to the Change data section. You can now access data reports, masking tool, data filtering tool, map annotations, layer library, satellite view, and the ability to upload your own data straight from the more options menu.
Click on the 
Or, read our step-by-step guide to learn about available menu options and their functionalities.
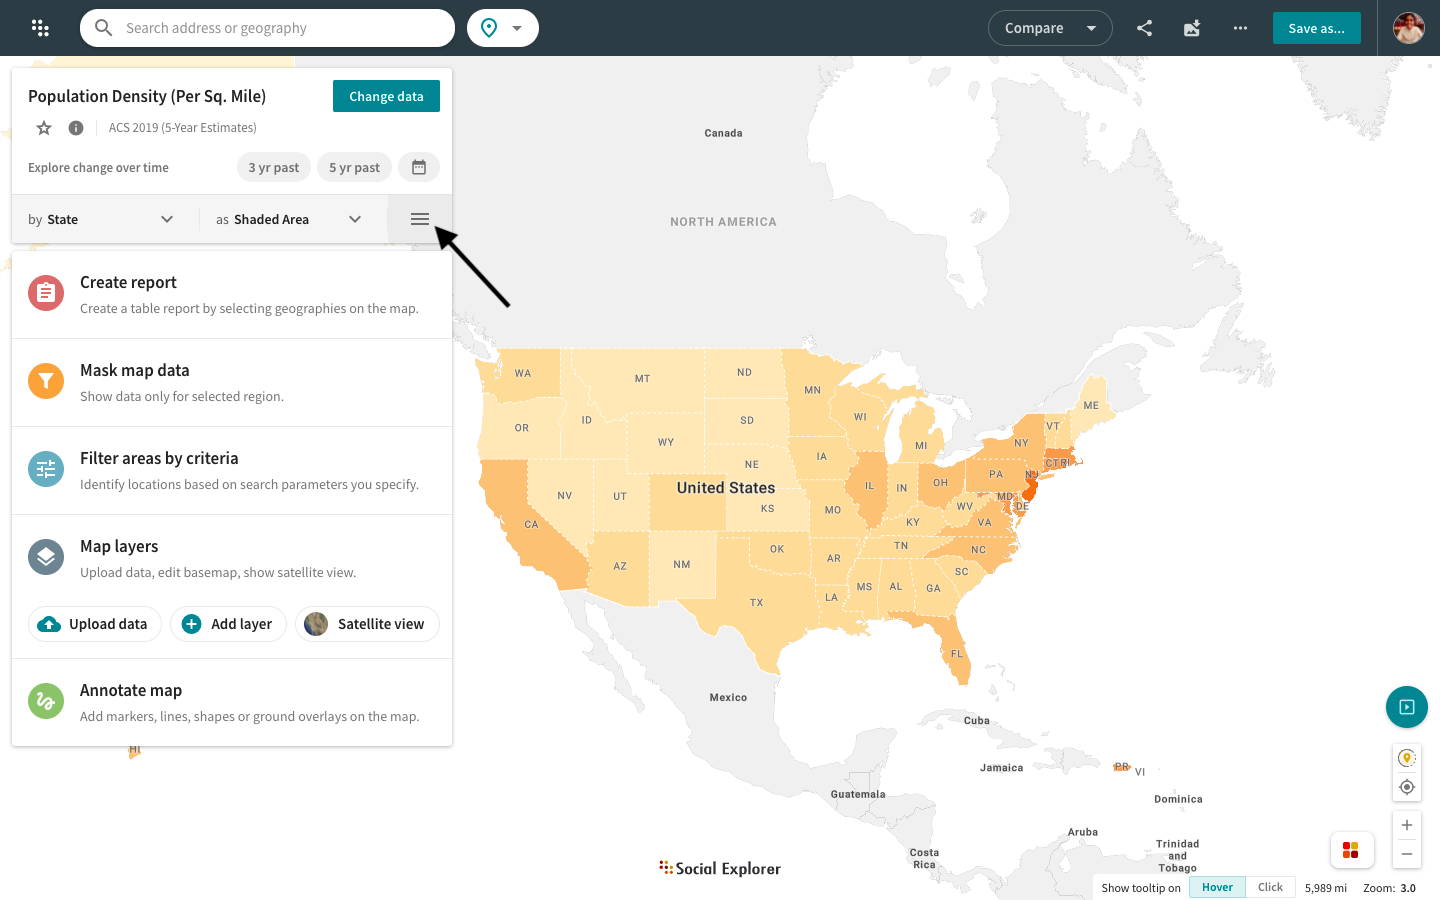
The data filtering tool allows you to filter geographies by data. Examine relationships and trends among different data points from the broadest to the most granular levels of geography, all on a single map. Click on the More options button and select Filter areas by criteria to get started. Find out more here.
Change geography for data display
Social Explorer includes data on many geographic levels from state, county, and city all the way down to the census block level. Click on the Change geography level dropdown menu in the Change data section to select the geography level by which you want to map your selected dataset.
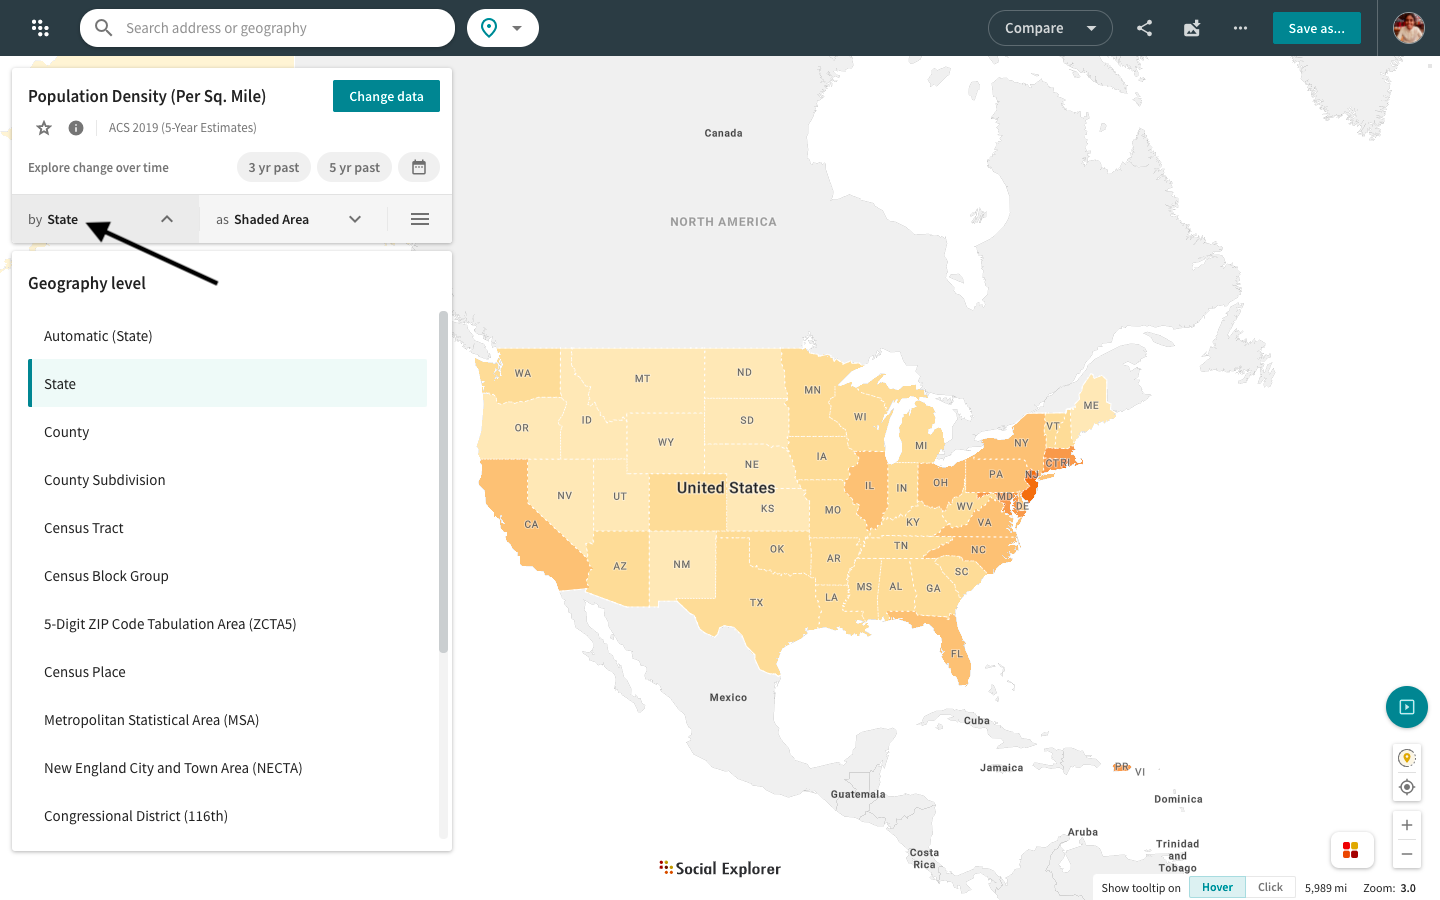
Learn more about how to change geography for data display with this guide.
Change data visualization type
Social Explorer can display data as a shaded area, a dot density, or a bubble map. Click on the Change visualization type dropdown menu in the Change data section and select the visualization type that works best with your dataset. You can also choose a color palette or edit cutpoints depending on your selected visualization type.
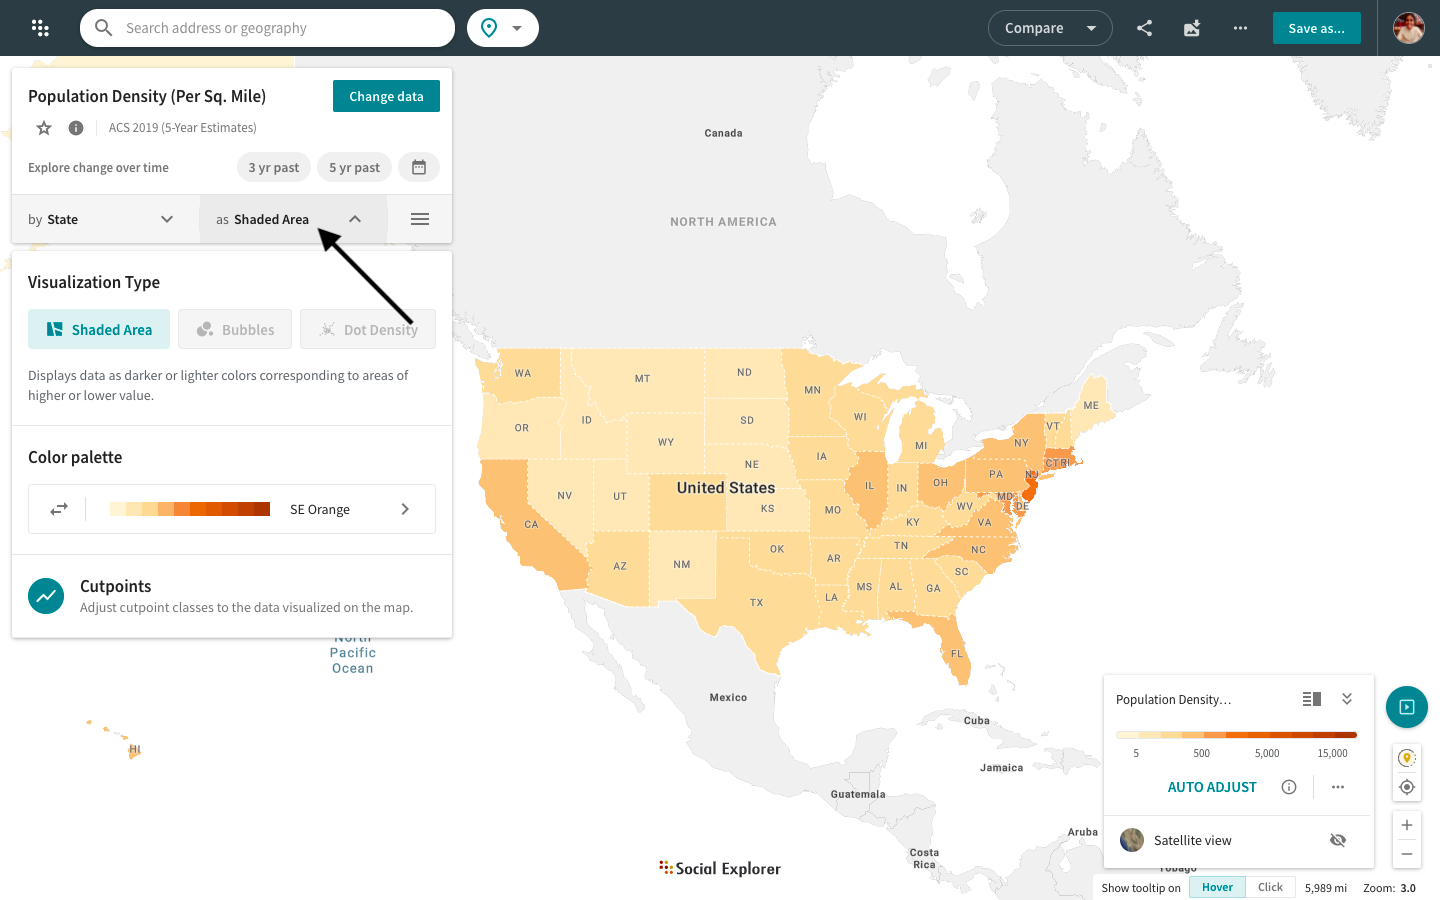
Some variables will not have all three options available because of the nature of the data. Head over to this guide to learn more about data visualization types.
The map legend is now located in the bottom left corner of the interface. You can switch between different legend modes: minimized, maximized, detailed, or simplified.