Using reports as templates
Social Explorer allows you to quickly and easily create and manage reports for one or thousands of variables and geographies in a matter of seconds.
However, we noticed certain users consistently using the same set of geographies or the same set of variables when creating reports, and we wanted to create a simpler way for them to use reports. For example, if you mainly use the same set of geographies while working with American Community Surveys, you might want a quicker way of creating reports. For this guide, we’ll use the United States, Arizona, Wyoming, Coconino County, Pima County, Big Horn County, Carbon County, and Crook County.
Creating the report you want to use as a template
We'll use Median Gross Rent and Poverty Status in for Population Age 18 to 64 for this guide, but you can use any other table you're interested in.
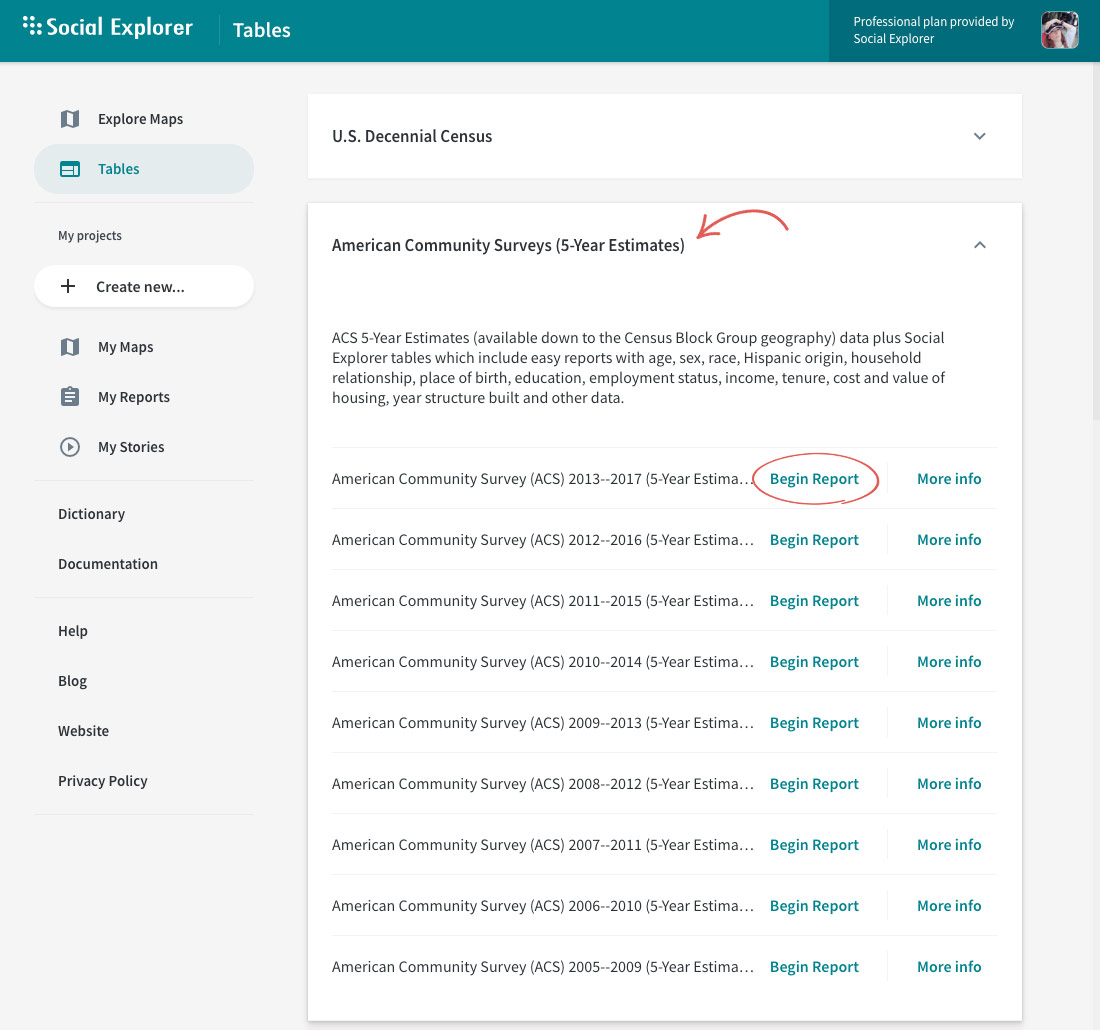
- Navigate to the Tables page.
- Click American Community Surveys (5-Year Estimates).
- In the dropdown, click Begin report next to American Community Survey (ACS) 2013–2017 (5-Year Estimates).
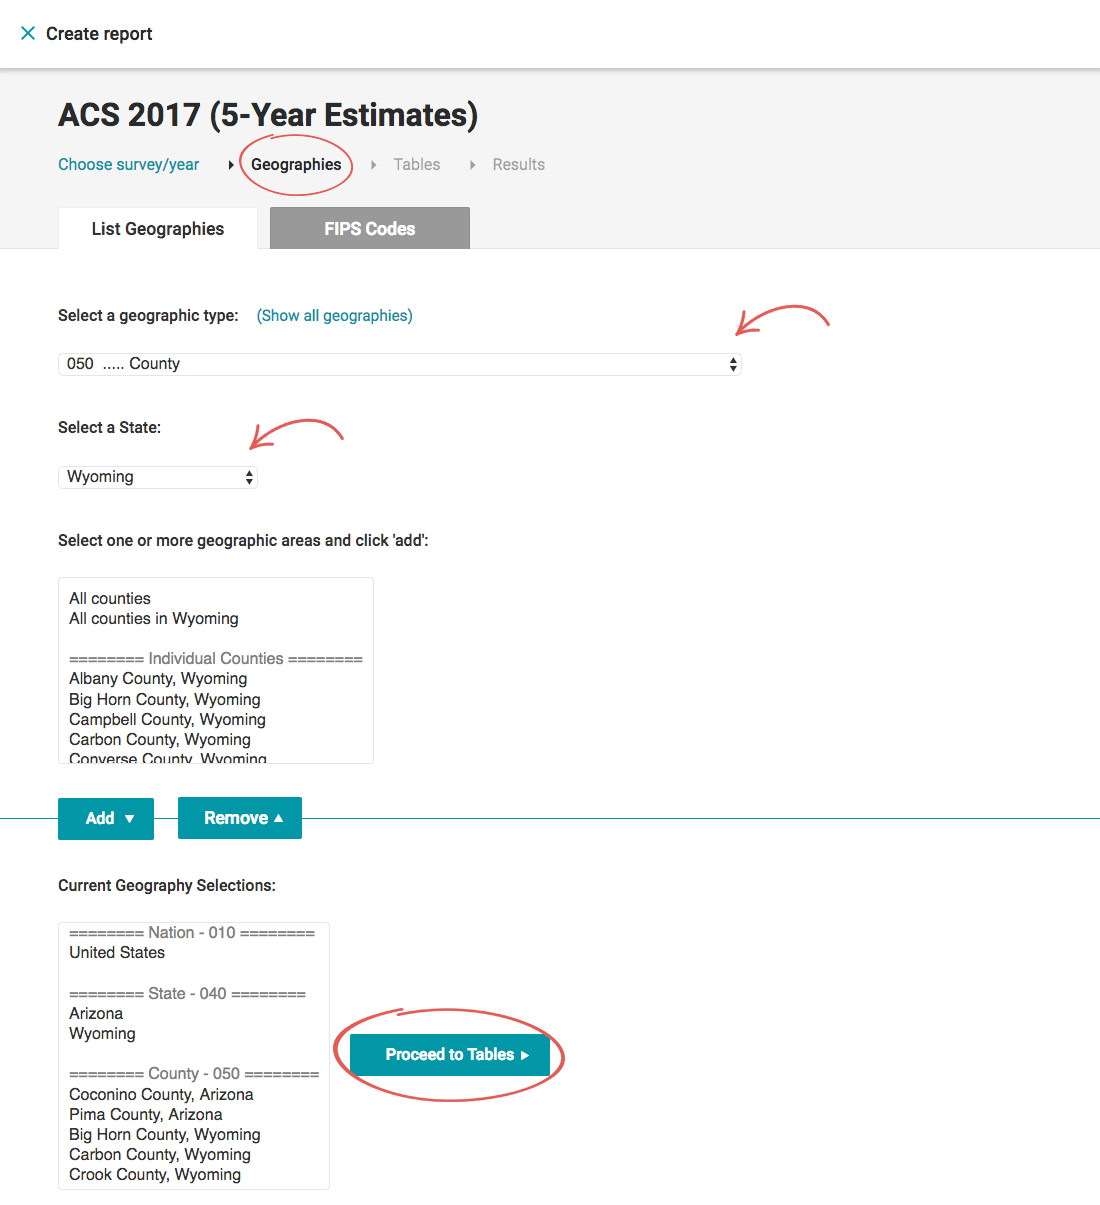
- Select United States and click Add.
- From the geographic type dropdown, select State.
- In the geographic areas field, select Arizona and Wyoming by holding down CTRL on your keyboard (Command on Mac) and clicking the names of the states. Or, add them individually one at a time.
- Click Add.
- From the geographic type dropdown, select County. From the State dropdown, select Arizona.
- In the geographic areas field, select Coconino County and Pima County by holding down CTRL on your keyboard (Command on Mac) and clicking the names of the counties.
- Click Add.
- Back in the State dropdown, select Wyoming.
- In the geographic areas field, select Big Horn County, Carbon County, and Crook County by holding down CTRL on your keyboard (Command on Mac) and clicking the names of the counties.
- Click Add.
- Click Proceed to Tables.
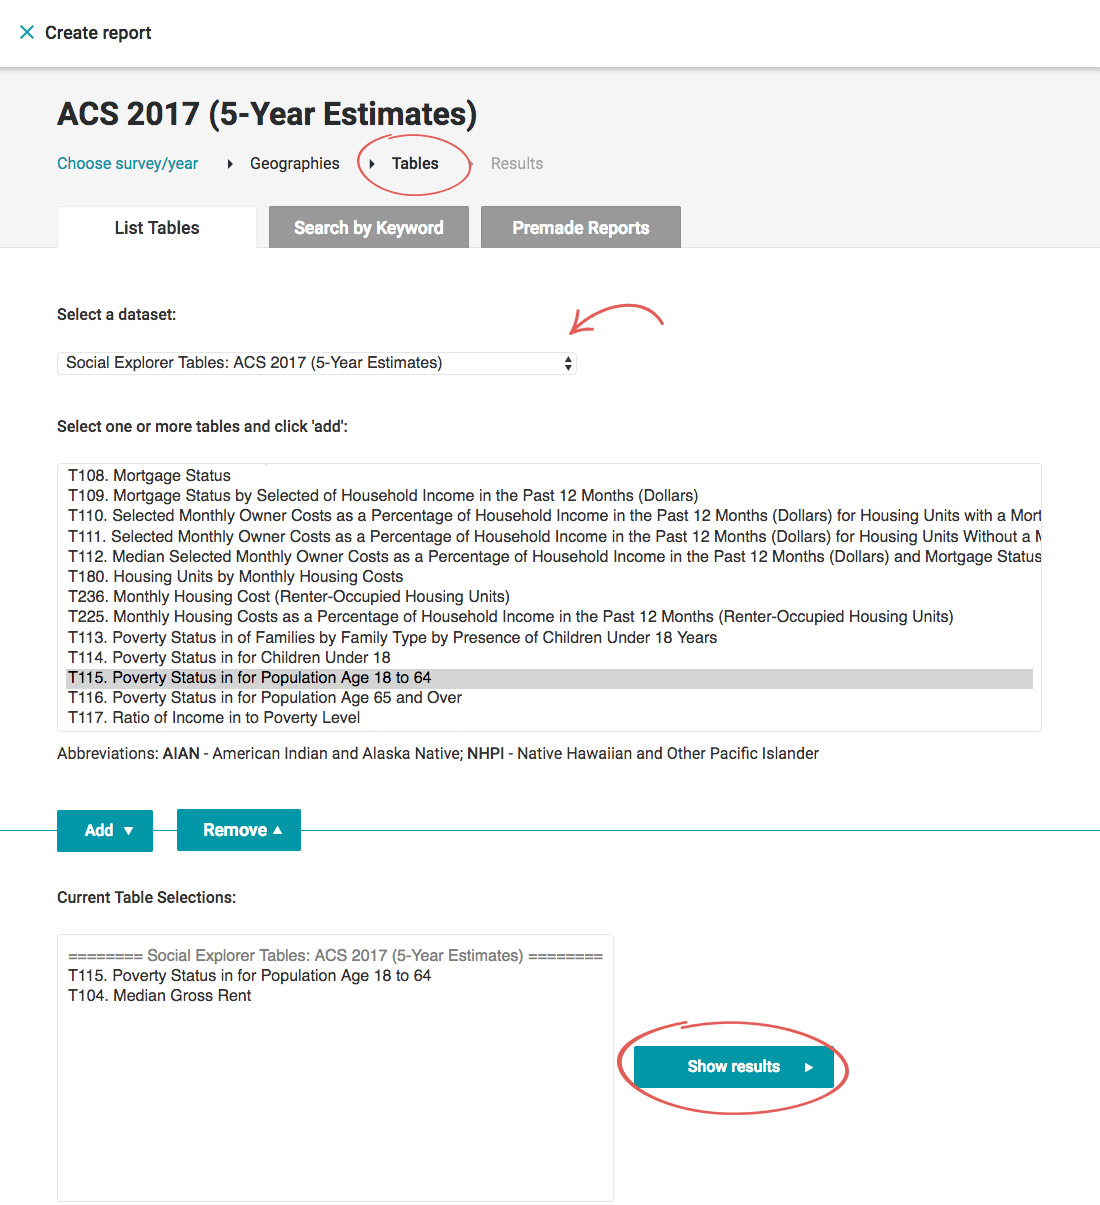
- In the Tables field, select A18009. Median Gross Rent and A13003B. Poverty Status in for Population Age 18 to 64 by holding down CTRL on your keyboard (Command on Mac) and clicking the names of the tables.
- Click Add.
- Click Show results.
Saving the template
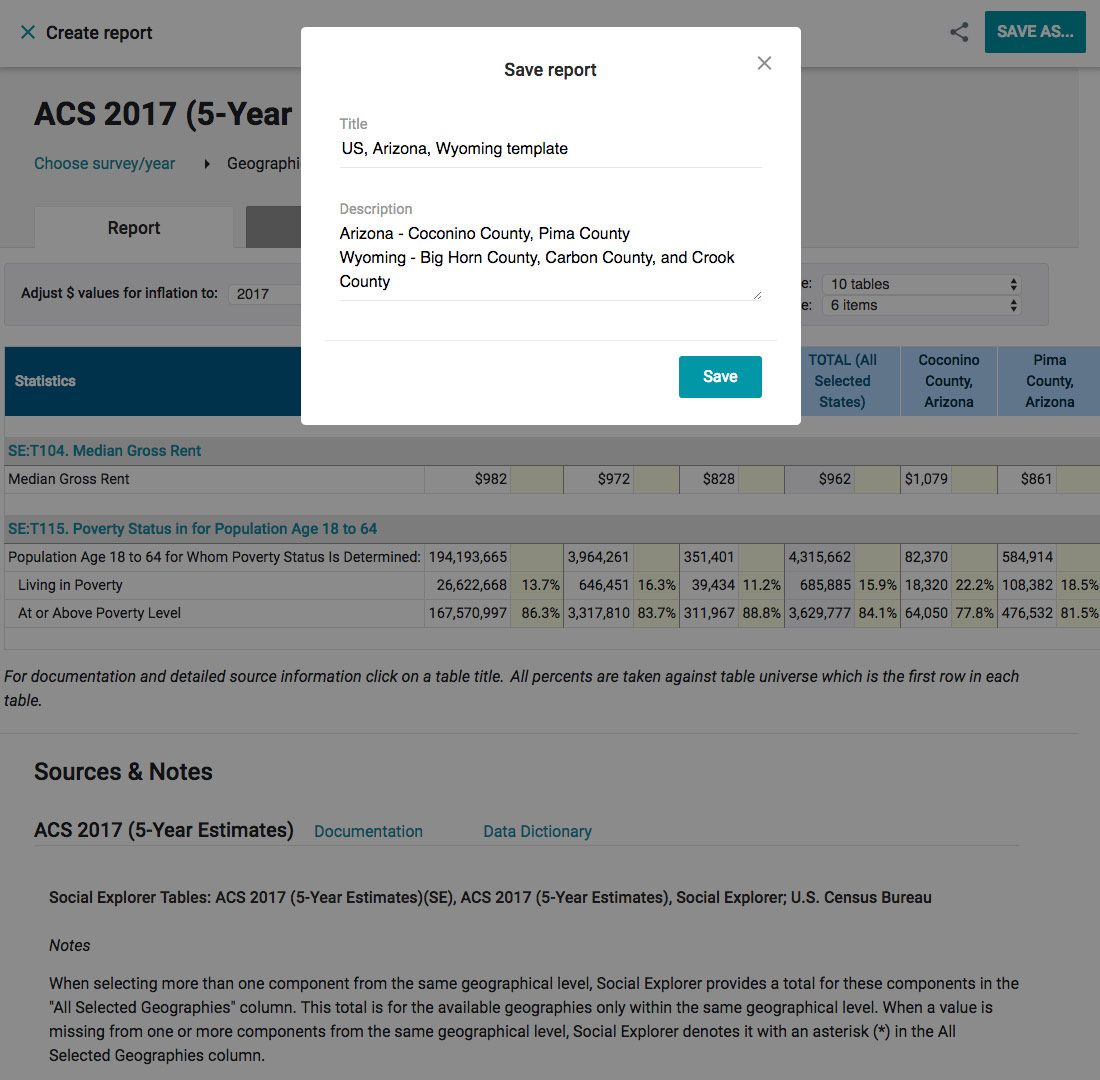
- In the upper right corner, click Save As…
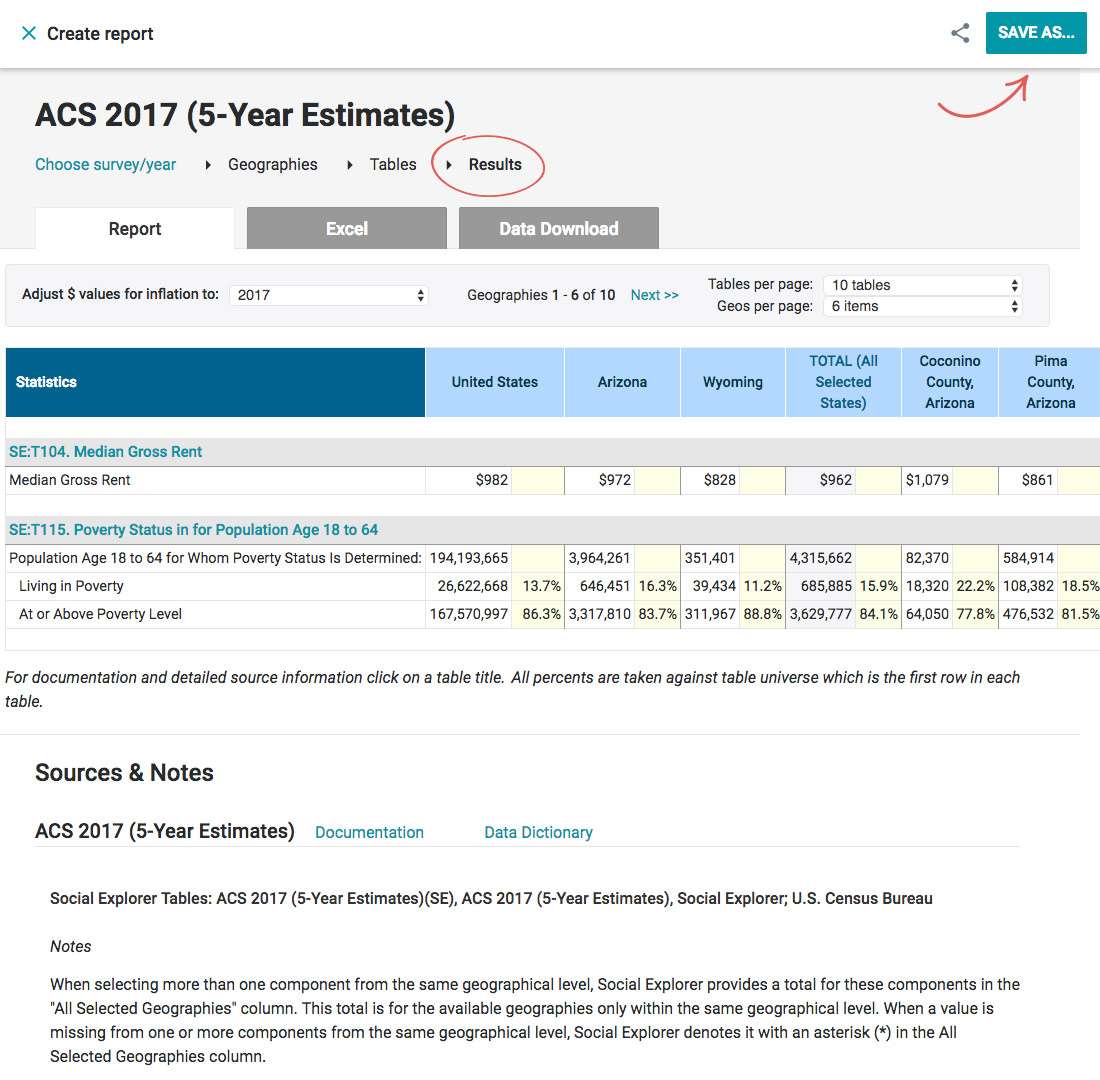
- Enter the name of your template. We’ll name it US, Arizona, Wyoming template.
Character limit is 100.
- In the Description field, enter the description. We’ll list all geographies so we can quickly check what the template is all about later on, without actually opening the template.
- Click Save.
For the new table name changes, click “Table Name Changes – ACS 5yr” at the bottom of the screen to find out more.
Using a template you created
So far, we’ve created your standard report. Let’s try and use it as a template, but this time around, we’ll select different variables for the same geographies.
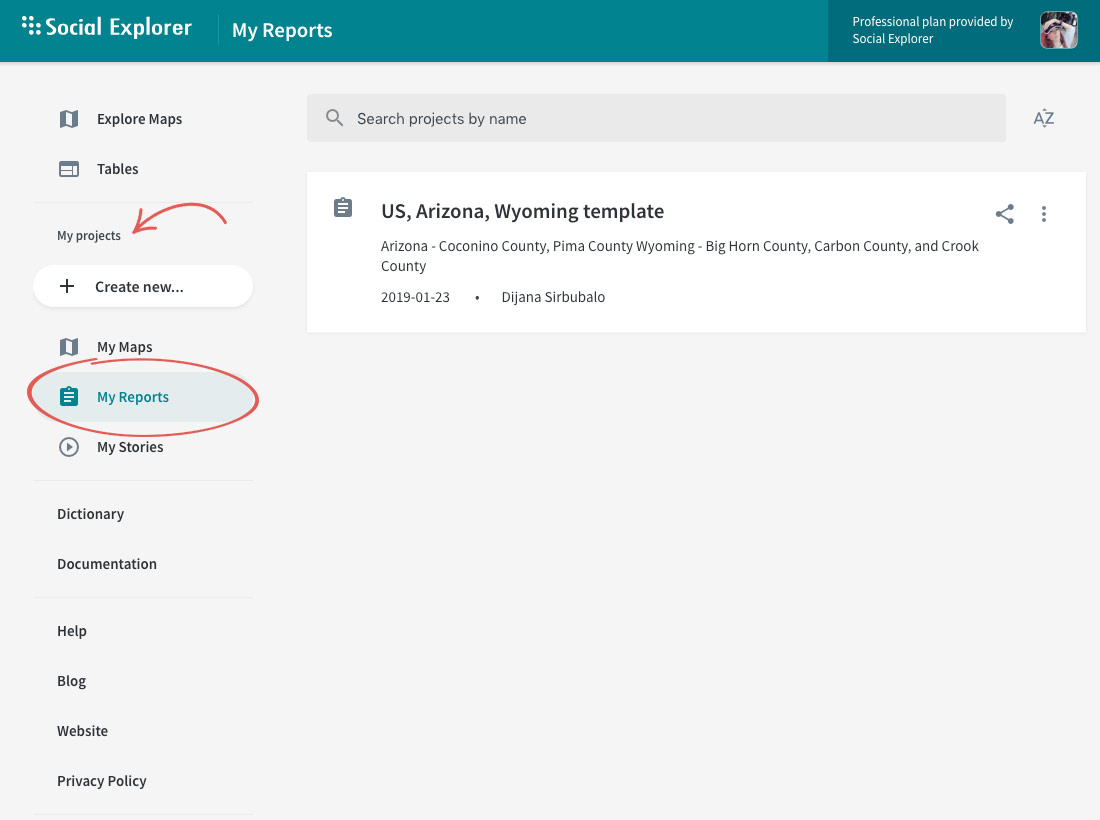
- Navigate to My Reports.
- Click US, Arizona, Wyoming template.
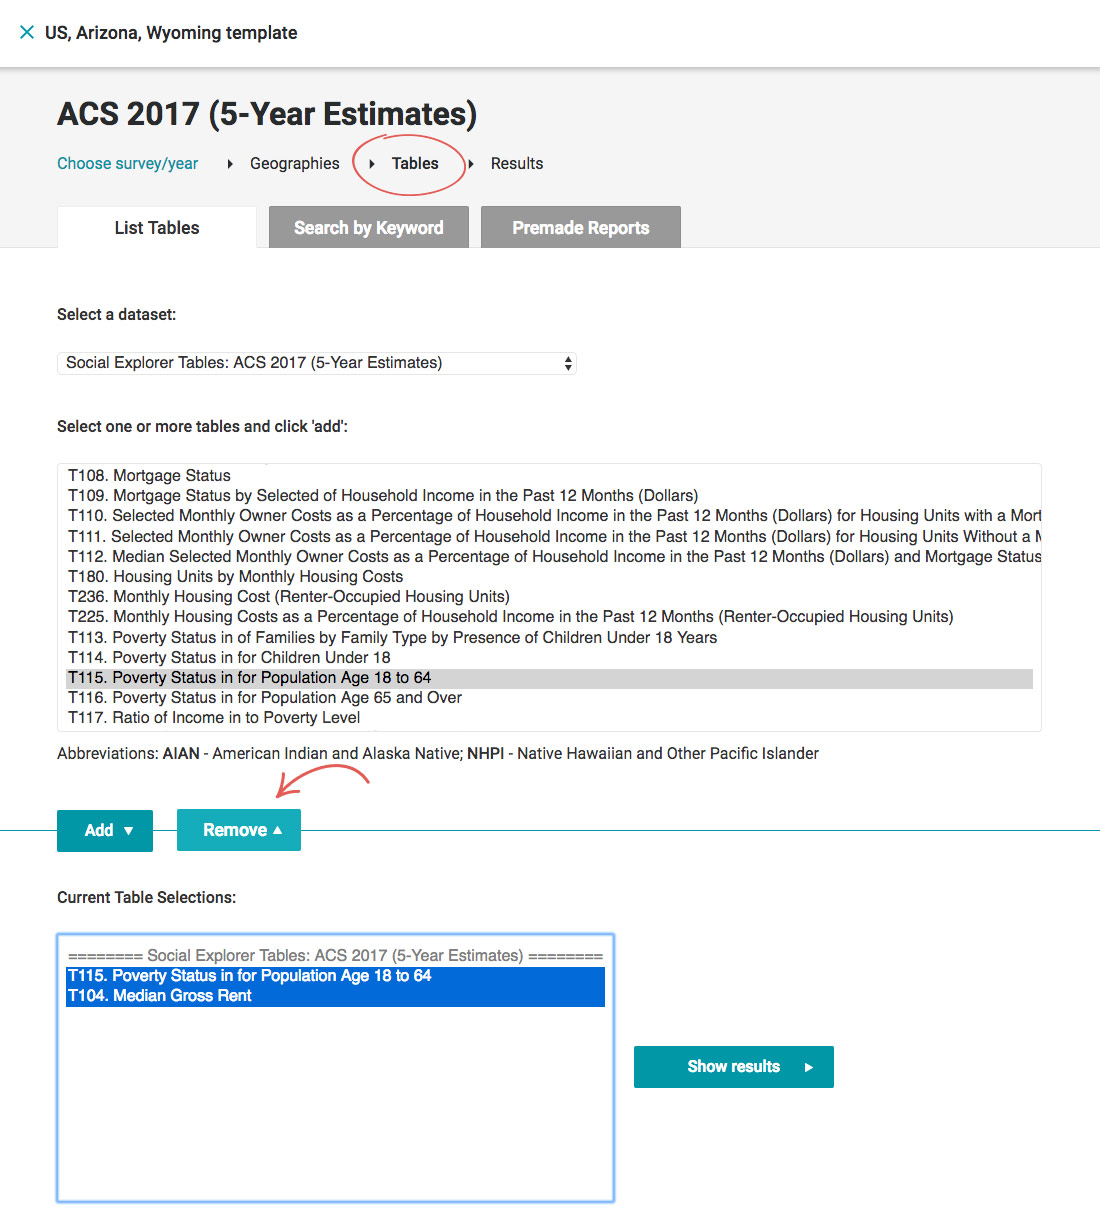
- At the top of the report, click Tables.
- Select all the tables in the Current Table Selections field and click Remove to start from scratch.
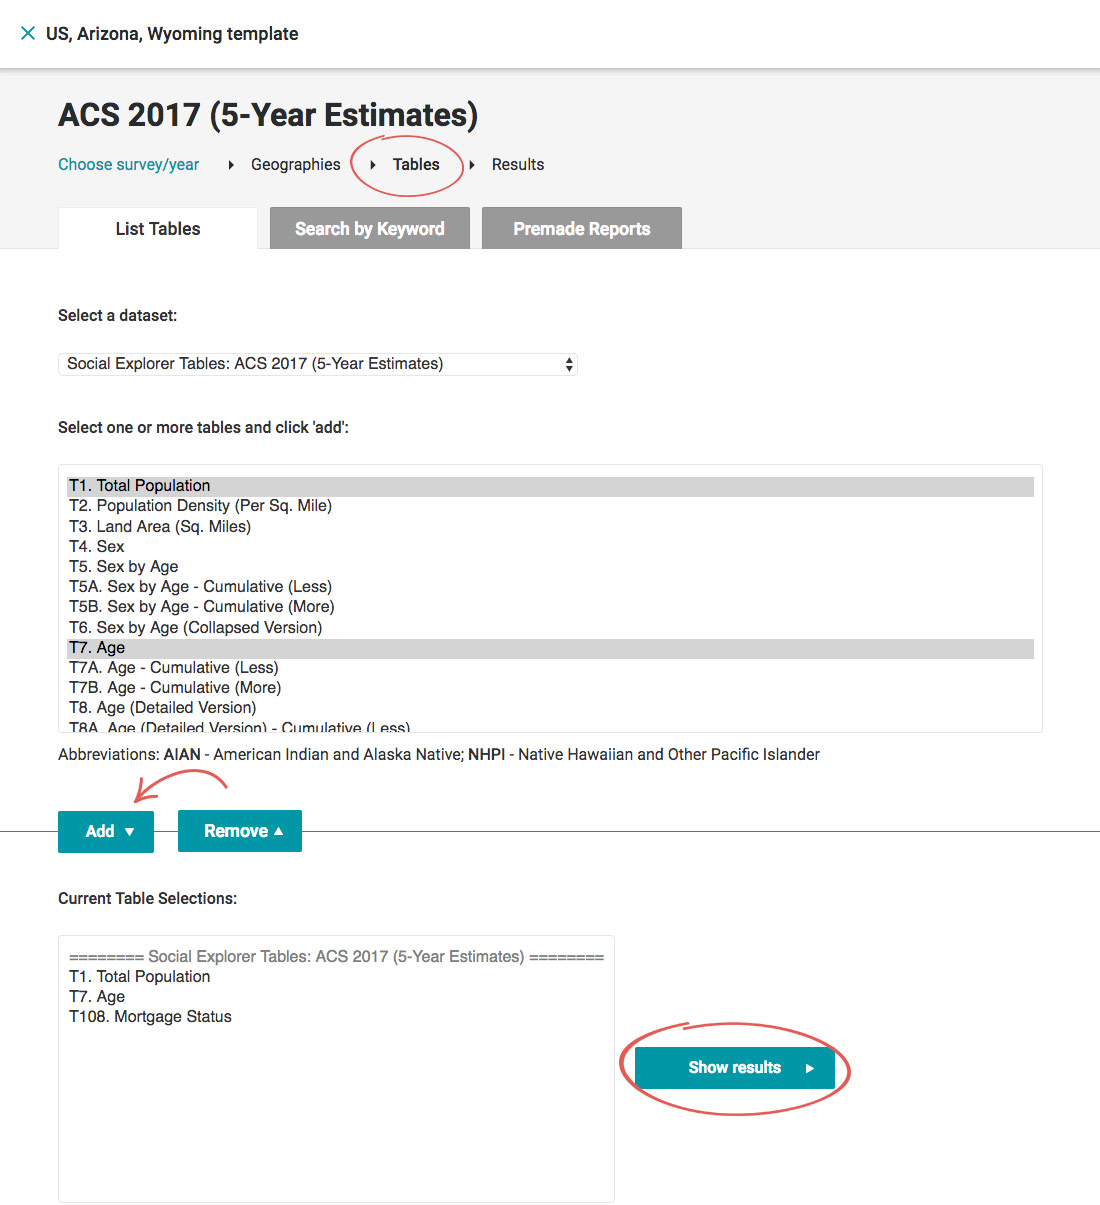
- In the Tables field, select the tables you’re interested in. Let’s say you want to check out A00001. Total Population, A01001. Age and A10041. Mortgage Status.
- Click Add and then Show results.
In the upper right corner, click Save As… and enter the name and description to save the report you just created as a new project without editing the existing template. Click Save to update your existing template with the new variables.
If you want to change the geographies and keep the same variables used in your template, follow these steps instead:
- Navigate to My Reports.
- Click US, Arizona, Wyoming template.
- At the top of the report, click Geographies.
- In the Current Geography Selection field, select all geographies and click Remove to start from scratch.
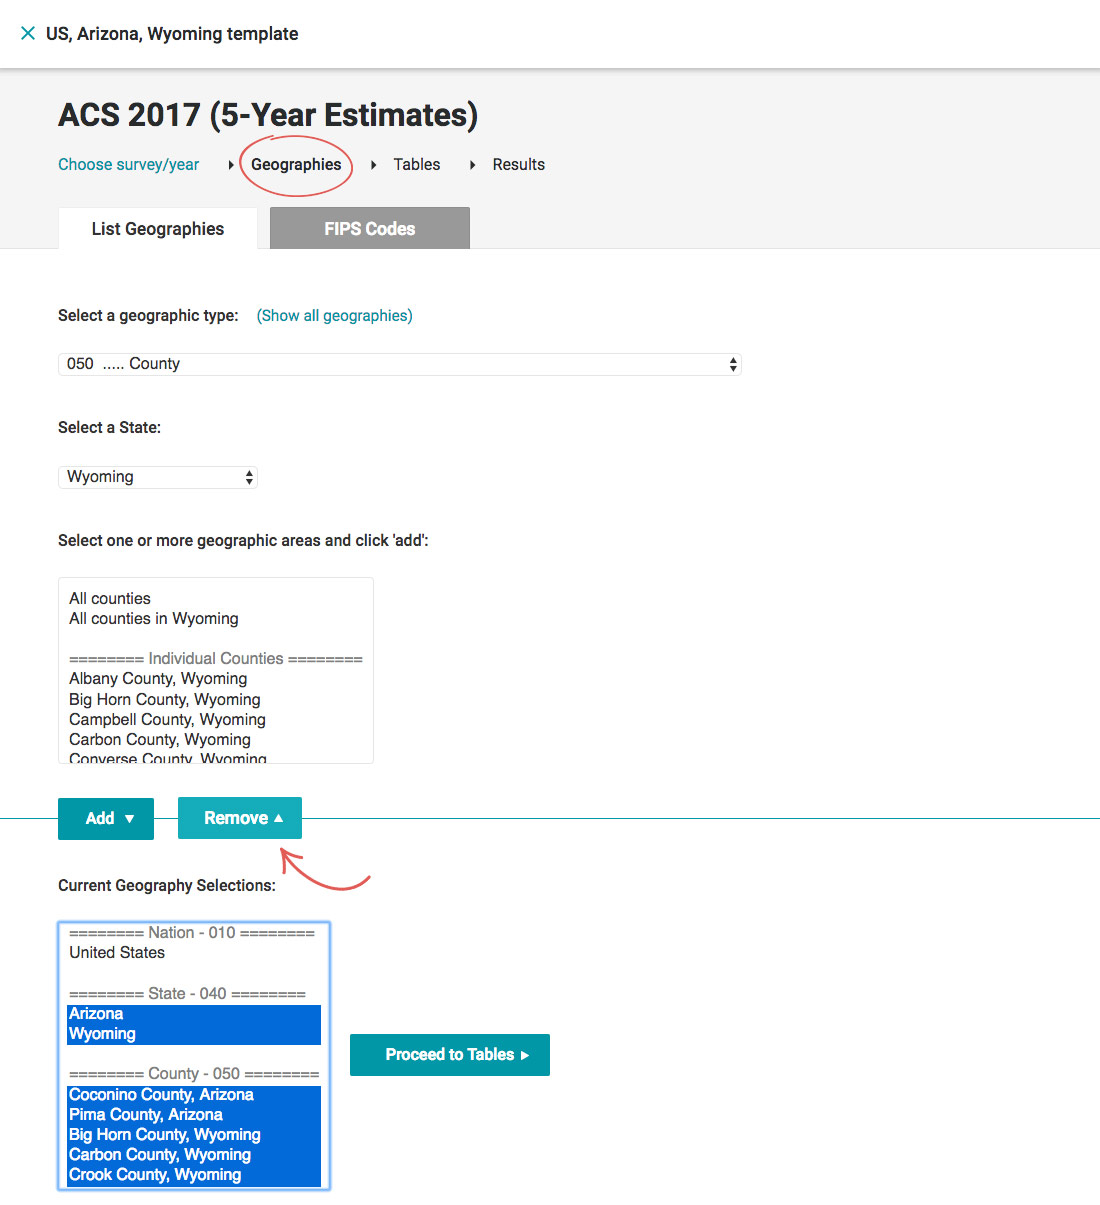
- Select and add new geographies and click Proceed to Tables.
- The variables are already listed in the Current Table Selections, so we'll click Show results.