
We use cookies to understand how the website is being used and to ensure you get the best possible experience.
By continuing to use this site, you consent to this policy.
About cookies
FRIDAY, DEC 15, 2017
Every ten years, the US Census Bureau undertakes an incredibly difficult, yet immensely important task – counting all the people living in the United States and recording the most essential demographic information such as age, sex, and race.
Looking at change over time for a specific area is a challenge many researchers face today. What makes this task difficult are changes in geographies as well as changes in Census variables, as Census questionnaires and tabulations change from census to census. Sometimes these changes are slight, but over time the shifts become larger and variables more difficult to compare. For example, formulation of the question regarding Hispanic origin changed from Census 1970 to Census 2000, which significantly affected the estimate of final number of Hispanics. In 1970 the Census asked about Spanish Origin, while in 2000, the term Latino was used in the question. All these things have to be taken into account when comparing variables across Census surveys. The overall problem researchers face today is harmonizing data and geographies so that information can be compared over time.
Social Explorer is working to make that possible. We’re creating new datasets to allow users to compare census data from 1970 to the present, using the most recent geographies.
Census tracts represent the basic enumeration units for the censuses, and their boundaries change over time to keep up with population shifts. For example, a popular city that grows would need to add more census tracts. Census tracts generally have a population size between 1,200 and 8,000 people, with an average size of around 4,000 people. In every new census, however, certain tracts are split, consolidated, or changed in other ways to reflect population growth or decline.
To research a specific area at the tract or county level over time, you need to be able to use the same set of geographical boundaries to examine the same variables.
Social Explorer is introducing a set of data and maps to research a consistent geography across the decades. While there are a few different methods to compensate for the geographic changes out there, we used Longitudinal Tract Data Base (LTDB), published by Professor John Logan and his colleagues, which combines area and population interpolation with exclusion of water-covered areas.
Read on to find out how we processed, analyzed and reallocated the data to make this possible.
The starting point in the LTDB approach was Topological Faces layer of the TIGER/Line shapefiles created by the U.S. Census Bureau. These shapefiles correspond to differences between blocks and tracts and other geographic layers as defined in the 2000 and 2010 censuses. The face polygons created by the intersection of these multiple geographic boundaries are essentially the smallest possible sub-block units in census geography and are referred to as “fragments”. Each of these fragments is uniquely identified by a topological face ID (TFID), and it includes several useful attributes: total area, an indicator of whether the face polygon is water or land, and all geocodes (from block ID to state FIPS code) in both the 2000 and 2010 census.
The next step was allocation of population data from 2000 to blocks within the tract which was based on the block’s share of the total tract population in 2000. This is followed by an estimate of the share of the 2000 block population that lies in each fragment within that block.
The LTDB approach for 1970 to 1990 used tract boundaries from the National Historic Geographic Information System (NHGIS) to create tract-level equivalents of Topological Faces relationship tables, which were available only for 2000-2010. The first step was to overlap the 2000 census tract boundary file with the 1990 boundary file and merge them into a single geographical layer. For each census tract that did not change between 1990 and 2000, the result is a single polygon and data record. For tracts that did change between 1990 and 2000, multiple records are present in the new layer. Then, 1990 census data were merged with this new layer using 1990 state, county and tract FIPS codes, and distributed to each fragment of the split tract using the area proportions as weights. The same procedure was repeated for 1970 and 1980, again using the 2000 tract file as the overlay. And lastly, the same population and area based interpolation method is used for bridging 2000 and 2010 data.

We used the LTDB relationship files as the starting point. These relationship weights are estimates of population and housing unit distribution on the 2010 geographies, as explained above. A detailed description of the methodology used for obtaining these weights can be found in the article published by Logan et al. in “The Professional Geographer.” In addition, Professor Logan published the study where LTDB estimates of the 2000 population on 2010 geographies were compared to other alternative estimates like Neighborhood Change Data Base (NCDB) and National Historical Geographic Information Systems (NHGIS). This study showed that LTDB and NHGIS perform much better in all situations, but are subject to some error when boundaries of both tracts and their component blocks are redrawn.
We used the LTDB relationship weights to reallocate the entire Census 1970, Census 1980, Census 1990, and Census 2000 data on 2010 geographies. Unlike any other source out there, we reallocated almost all the Census variables, not just a select few.
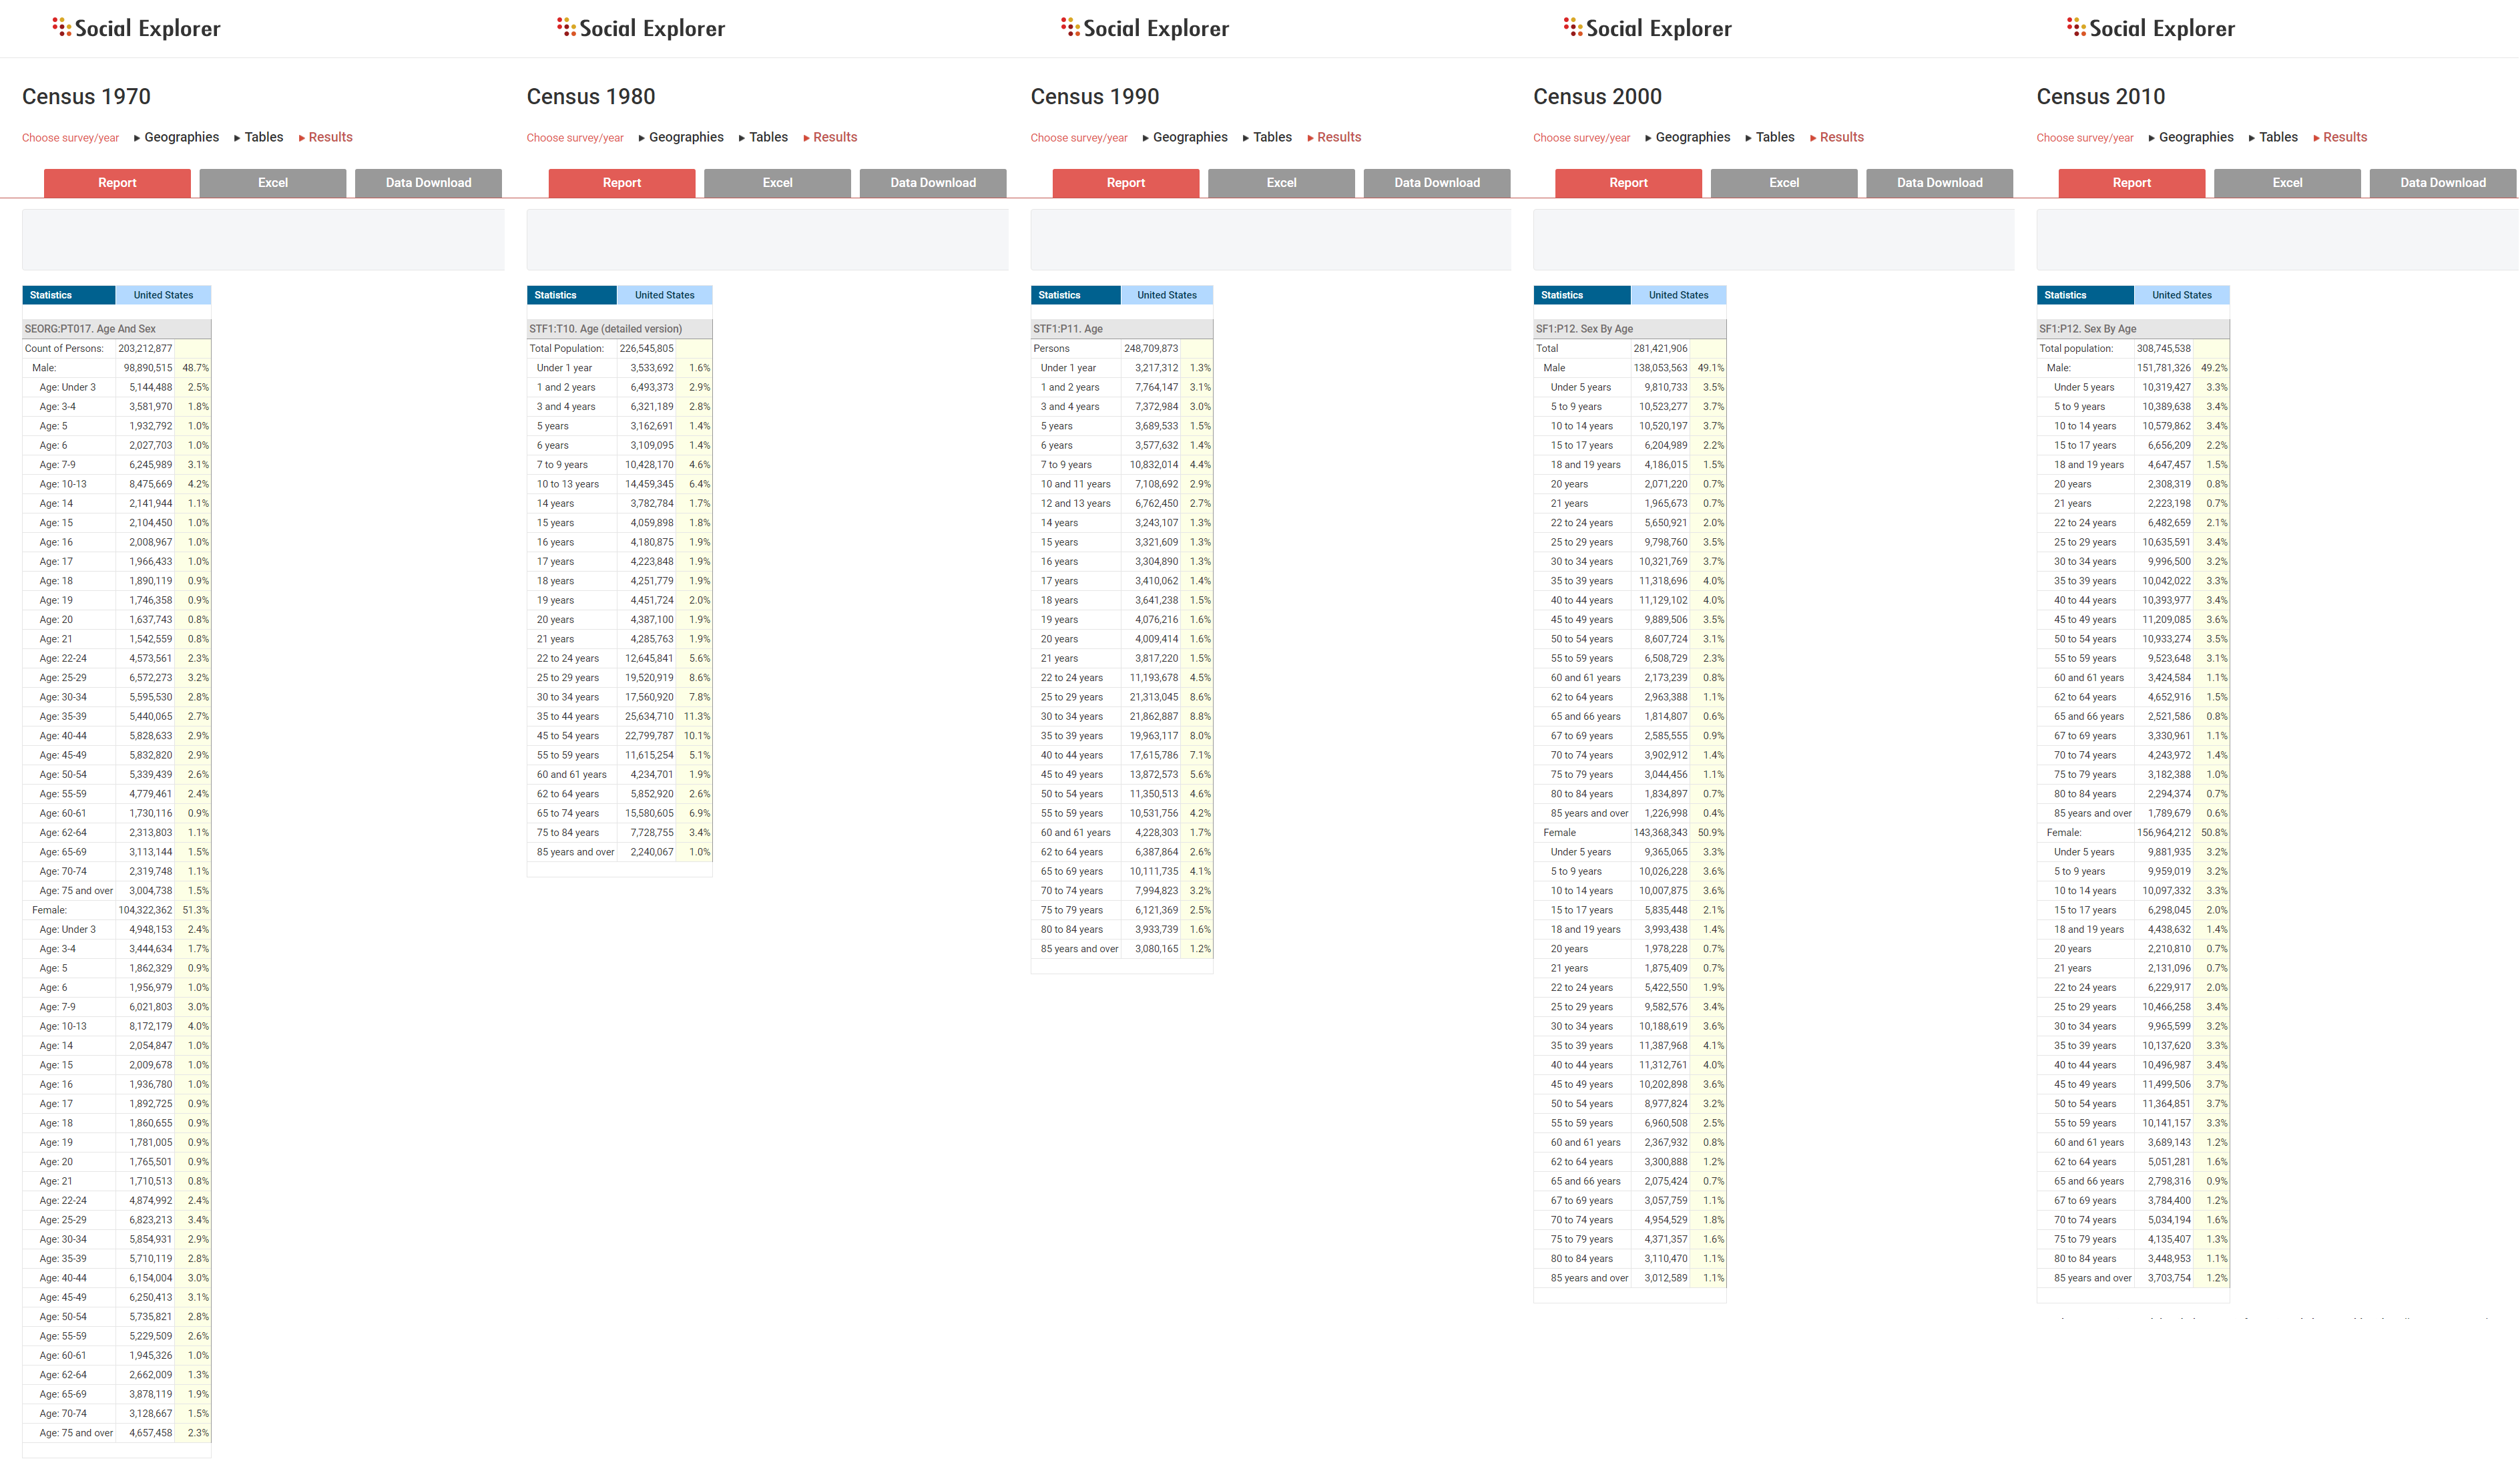
While the overall purpose and approach to decennial censuses hasn’t drastically changed, census question wording and table structures have been going through minor, yet constant changes that affect how the data are reported and comparisons are made.
For example, in tracking age-related data from 1970 to 2010, you’ll notice that the original tables do not contain the age variable. The most similar variable to it is age and sex, where male and female population has been divided into 27 age groups each. The solution seems simple – you can track changes in the age and sex category through time. However, when you check out the Census 1990 data, you’ll notice there’s no age and/by sex category.
Tracking change over time is difficult when not only are the geographies different, but the variables you need to track are different as well. Social Explorer is working to overcome this by linking the variables and creating hybrid variables that are consistent and applicable to all the censuses. Our data scientists are busy linking all variables, which will allow our users to track changes easily and intuitively at one place.
We’ve already computed variables such as age, age – cumulative, sex by age, sex by age – cumulative, and many others that were not originally available for that census year. This way, our users can track the changes in any age-related variable they might be interested in, even if it didn’t appear in the original questionnaire for a certain year.
As of right now, you can browse all Census data on the most recent geography in a separate map for each year, as well as through reports, but the final milestone for this project will be creating a user-friendly interface that will allow you to instantly explore change over time in a single map.
We’d like to thank Brown University’s Professor John Logan for generously allowing us use of his insightful work and reallocation fractions provided in Longitudinal Tract Data Base (LTDB).