


| Documentation: | ACS 2022 (5-Year Estimates) |
you are here:
choose a survey
survey
document
chapter
Publisher: U.S. Census Bureau
Survey: ACS 2022 (5-Year Estimates)
| Document: | 2022 ACS 1-year and 2018-2022 ACS 5-year Data Releases: Technical Documentation |
| citation: | Social Explorer; U.S. Census Bureau; 2022 ACS 1-year and 2018-2022 ACS 5-year Data Releases : Technical Documentation. |
Chapter Contents
2022 ACS 1-year and 2018-2022 ACS 5-year Data Releases: Technical Documentation
This document provides some basic instructions for obtaining the ACS standard errors needed to do statistical tests, as well as performing the statistical testing.
The location and type of ACS data, as well as when it was released, will determine if standard errors (SE) or margins of error (MOE) are readily available or users have to calculate them. If the estimate of interest is published on data.census.gov, then that should be the source of the MOE.
Note that beginning in 2022, data.census.gov will be the dissemination platform. It replaces American FactFinder (AFF). Possible sources for data and where to obtain standard errors are:
Note that beginning in 2022, data.census.gov will be the dissemination platform. It replaces American FactFinder (AFF). Possible sources for data and where to obtain standard errors are:
- ACS data from published tables on data.census.gov
All ACS estimates from tables on data.census.gov include either the 90 percent margin of error or 90 percent confidence bounds.
The margin of error is the maximum difference between the estimate and the upper and lower confidence bounds. Most tables on AFF containing 2005 or later ACS data display the margin of error.
Use the margin of error to calculate the standard error (dropping the "+/-" from the displayed value first) as:
Standard Error = Margin of Error / Z
where Z = 1.645 for 2006 ACS data and recent years. Users of 2005 and earlier ACS data should use Z= 1.65
If confidence bounds are provided instead (as with most ACS data products for 2004 and earlier), calculate the margin of error first before calculating the standard error:
Margin of Error = max (upper bound - estimate, estimate - lower bound)
All published ACS estimates use 1.645 (for 2006 and recent years) to calculate 90 percent margins of error and confidence bounds. ACS estimates for years earlier than 2006 should use 1.65. Other surveys may use other values.
- ACS Application Programming Interface (API)
The Census Bureau has an application programming interface, or API, to allow the public to incorporate ACS and other Census statistics into websites and mobile apps.
Estimates and 90 percent margin of errors for the 1-year, 3-year and 5-year ACS Summary Files and Data Profiles are available through the Census API. The standard errors are calculated using the same method explained above.
More information about the API may be found at https://www.census.gov/developers/ - ACS Summary Files
The ACS Summary File is a set of comma-delimited text files that contain the detailed tables for the ACS 1-year, 3-year, and 5-year data that is also available on American FactFinder.
Documentation for how to access and use the Summary Files is available at: https://www.census.gov/programs-surveys/acs/technical-documentation/summary-file-documentation.html - ACS Public Use Microdata Sample (PUMS) Tabulations
Using the methods described in the PUMS Accuracy of the Data documentation users can calculate their own estimates for characteristics as well as standard errors for their tabulations using a generalized variance formula method using a generalized variance formula (GVF) method using the design factors or a successive difference replication (SDR) method using the replicate weights.
The PUMS technical documentation can be used with the ACS PUMS data files to calculate standard errors or margin of errors.
The PUMS technical documentation is available at: http://www.census.gov/programssurveys/acs/technical-documentation/pums/documentation.html. - Census Bureau Apps
The Census Bureau has released several apps which allow an easy method for obtain relevant data for their needs. Apps such as Census Business Builder, My Congressional District and My Tribal Area provide a select set of characteristics relevant to the target audience.
Data may be viewed in the app or downloaded. A list of apps may be found at: https://www.census.gov/data/data-tools.html - Data from FTP Sites
Data for the ACS Summary Files, PUMS files and other data may be obtained via the appropriate Census FTP site. A list of the locations for various data is available at: https://www.census.gov/programs-surveys/acs/data/data-via-ftp.html
Once users have obtained standard errors for the basic estimates, there may be situations where users create derived estimates, such as percentages or differences that also require standard errors.
All methods in this section are approximations and users should be cautious in using them. This is because these methods do not consider the correlation or covariance between the basic estimates. They may be overestimates or underestimates of the derived estimate's standard error depending on whether the two basic estimates are highly correlated in either the positive or negative direction. As a result, the approximated standard error may not match direct calculations of standard errors or calculations obtained through other methods.

As the number of basic estimates involved in the sum or difference increases, the results of this formula become increasingly different from the standard error derived directly from the ACS microdata. Care should be taken to work with the fewest number of basic estimates as possible. If there are estimates involved in the sum that are controlled in the weighting then the approximate standard error can be tremendously different.
Here we define a proportion as a ratio where the numerator is a subset of the denominator, for example the proportion of persons 25 and over with a high school diploma or higher.
Let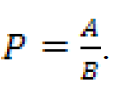
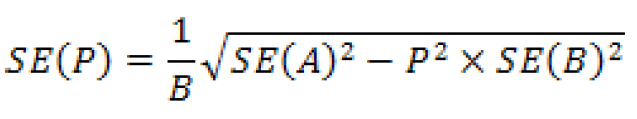
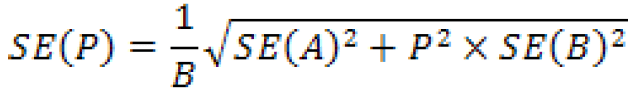
If the value under the square root sign is negative, then instead use
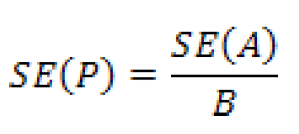
If P = 1 then use
If Q = 100% x P (a percent instead of a proportion), then SE(Q) = 100% x SE(P).
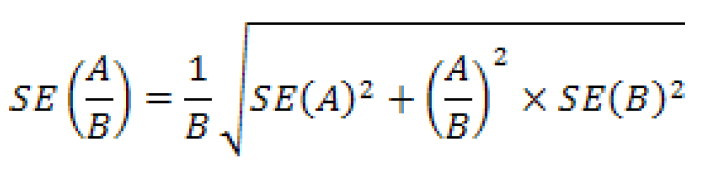
If the estimate is a ratio but the numerator is not a subset of the denominator, such as persons per household, per capita income, or percent change, then
For a product of two estimates - for example if users want to estimate a proportion's numerator by multiplying the proportion by its denominator - the standard error can be approximated as
Users may combine these procedures for complicated estimates. For example, if the desired estimate is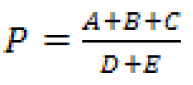 then SE(A+B+C) and SE(D+E) can be estimated first, and then those results used to calculate SE(P).
For examples of these formulas, please see any Accuracy of the Data document available on the ACS website at: http://www.census.gov/programs-surveys/acs/technical-documentation/codelists.html.
All methods in this section are approximations and users should be cautious in using them. This is because these methods do not consider the correlation or covariance between the basic estimates. They may be overestimates or underestimates of the derived estimate's standard error depending on whether the two basic estimates are highly correlated in either the positive or negative direction. As a result, the approximated standard error may not match direct calculations of standard errors or calculations obtained through other methods.
- Sum or Difference of Estimates
As the number of basic estimates involved in the sum or difference increases, the results of this formula become increasingly different from the standard error derived directly from the ACS microdata. Care should be taken to work with the fewest number of basic estimates as possible. If there are estimates involved in the sum that are controlled in the weighting then the approximate standard error can be tremendously different.
- Proportions and Percents
Here we define a proportion as a ratio where the numerator is a subset of the denominator, for example the proportion of persons 25 and over with a high school diploma or higher.
Let
If the value under the square root sign is negative, then instead use
If P = 1 then use
If Q = 100% x P (a percent instead of a proportion), then SE(Q) = 100% x SE(P).
- Means and Other Ratios
If the estimate is a ratio but the numerator is not a subset of the denominator, such as persons per household, per capita income, or percent change, then
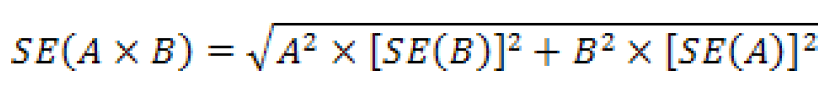
- Products
For a product of two estimates - for example if users want to estimate a proportion's numerator by multiplying the proportion by its denominator - the standard error can be approximated as
Users may combine these procedures for complicated estimates. For example, if the desired estimate is
then SE(A+B+C) and SE(D+E) can be estimated first, and then those results used to calculate SE(P).For examples of these formulas, please see any Accuracy of the Data document available on the ACS website at: http://www.census.gov/programs-surveys/acs/technical-documentation/codelists.html.
Once standard errors have been obtained, doing the statistical test to determine significance is not difficult. The determination of statistical significance takes into account the difference between the two estimates as well as the standard errors of both estimates. For two estimates, A and B, with standard errors SE(A) and SE(B), let
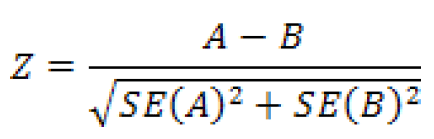
If Z < -1.645 or Z > 1.645, then the difference between A and B is significant at the 90 percent confidence level. Otherwise, the difference is not significant. This means that there is less than a 10 percent chance that the difference between these two estimates would be as large or larger by random chance alone.
This is the method used in determining statistical significance for the ACS Comparison Profiles published on AFF. Note that the user's determination of statistical significance may not match the results in the Comparison Profile for the same pair of estimates, because the significance tests for Comparison Profiles are made using unrounded standard errors. Standard errors obtained from the rounded margins of error or confidence bounds are unlikely to match the unrounded standard error, and so statistical tests may differ.
Users may choose to apply a confidence level different from 90 percent to their tests of statistical significance. For example, if Z < -1.96 or Z > 1.96, then the difference between A and B is significant at the 95 percent confidence level.
This method can be used for any types of estimates: counts, percentages, proportions, means, medians, etc. It can be used for comparing across years, or across surveys. If one of the estimates is a fixed value or comes from a source without sampling error (such as a count from the 2010 Census), use zero for the standard error for that estimate in the above equation for Z.
Making comparisons between ACS single-year and multiyear estimates is very difficult, and is not advised.
In addition, using the rule of thumb of overlapping confidence intervals does not constitute a valid significance test and users are discouraged from using that method.

