


| Documentation: | ACS 2014 (5-Year Estimates) |
| Document: | ACS 2014-5yr Summary File: Technical Documentation |
| citation: | Social Explorer; U.S. Census Bureau; American Community Survey 2014 Summary File: Technical Documentation. |
| Field of Degree Classification | ||
| Five-Group Classification | Fifteen-Group Classification | Examples |
| Science and Engineering | Computers, Mathematics and Statistics | Computer Science, Mathematics, General Statistics |
| Biological, Agricultural, and Environmental Sciences | Cellular and Molecular Biology, Soil Sciences, Natural Resource Management | |
| Physical and Related Sciences | Physics, Organic Chemistry, Astronomy | |
| Psychology | Psychology, Counseling, Child Psychology | |
| Social Sciences | Criminology, Sociology, Political Science | |
| Engineering | Chemical Engineering, Thermal Engineering, Electrical Engineering | |
| Multidisciplinary Studies | Nutritional Science, Cognitive Science, Behavioral Science | |
| Science and Engineering Related | Science and Engineering Related | Pre-Med, Physical Therapy, Mechanical Engineering Technology |
| Business | Business | Business Administration, Accounting, Human Resources Development |
| Education | Education | Early Childhood Education, Higher Education Administration, Special Education |
| Arts, Humanities, and Other | Literature and Languages | English, Foreign Language and Literature, Spanish |
| Liberal Arts and History | Philosophy, Theology, American History | |
| Visual and Performing Arts | Interior Design, Dance, Voice | |
| Communications | Mass Communications, Journalism, Public Relations | |
| Other | Public Administration, Pre-law, Kinesiology | |
| Four Main Group Classifications and Thirty-Nine Subgroup Classifications of Languages Spoken at Home with Illustrative Examples | |
| Four Main Group Classifications | Thirty-Nine Subgroup Classifications |
| Spanish | Spanish or Spanish Creole Examples: Ladino, Pachuco |
French Examples: Cajun, Patois | |
French Creole Example: Haitian Creole | |
| Italian | |
Portuguese or Portuguese Creole Example: Papia Mentae | |
German Example: Luxembourgian | |
| Yiddish | |
Other West Germanic languages Examples: Dutch, Pennsylvania Dutch Afrikaans | |
Scandinavian languages Examples: Danish, Norwegian, Swedish | |
| Other Indo-European languages | Greek |
| Russian | |
| Polish | |
Serbo-Croatian Examples: Croatian, Serbian | |
Other Slavic languages Examples: Czech, Slovak, Ukrainian | |
| Armenian | |
| Persian | |
| Gujarati | |
| Hindi | |
| Urdu | |
Other Indic languages Examples: Bengali, Marathi, Punjabi, Romany | |
Other Indo-European languages Examples: Albanian, Gaelic, Lithuanian, Romanian | |
| Asian and Pacific Island languages | Chinese Examples: Cantonese, Formosan, Mandarin |
| Japanese | |
| Korean | |
| Mon-Khmer, Cambodian | |
| Hmong | |
| Thai | |
| Laotian | |
| Vietnamese | |
Other Asian languages Examples: Dravidian languages (Malayalam, Telugu, Tamil), Turkish | |
| Tagalog | |
Other Pacific Island languages Examples: Chamorro, Hawaiian, Ilocano, Indonesian, Samoan | |
| All other languages | Navajo |
Other Native North American languages Examples: Apache, Cherokee, Dakota, Pima, Yupik | |
| Hungarian | |
| Arabic | |
| Hebrew | |
African languages Examples: Amharic, Ibo, Yoruba, Bantu, Swahili, Somali | |
Other and unspecified languages Examples: Syriac, Finnish, Other languages of the Americas, not reported | |
| Poverty Factors | |
| The 2013 Poverty Factors: | |
| Interview Month | Poverty Factors |
| January | 2.37897 |
| February | 2.3821 |
| March | 2.38598 |
| April | 2.3889 |
| May | 2.39102 |
| June | 2.39372 |
| July | 2.39719 |
| August | 2.40107 |
| September | 2.40409 |
| October | 2.40646 |
| November | 2.40839 |
| December | 2.41085 |
| Poverty Thresholds | |||||||||
| Poverty Thresholds in 1982, by Size of Family and Number of Related Children Under 18 Years Old (Dollars) | |||||||||
| Size of family unit | Related children under 18 years | ||||||||
| None | One | Two | Three | Four | Five | Six | Seven | Eight or more | |
| One person (unrelated individual) | N/A | N/A | N/A | N/A | N/A | N/A | N/A | N/A | N/A |
| Under 65 years | 5,019 | N/A | N/A | N/A | N/A | N/A | N/A | N/A | N/A |
| 65 years and over | 4,626 | N/A | N/A | N/A | N/A | N/A | N/A | N/A | N/A |
| Two persons | N/A | N/A | N/A | N/A | N/A | N/A | N/A | N/A | N/A |
| Householder under 65 years | 6,459 | 6,649 | N/A | N/A | N/A | N/A | N/A | N/A | N/A |
| Householder 65 years and over | 5,831 | 6,624 | N/A | N/A | N/A | N/A | N/A | N/A | N/A |
| Three persons | 7,546 | 7,765 | 7,772 | N/A | N/A | N/A | N/A | N/A | N/A |
| Four persons | 9,950 | 10,112 | 9,783 | 9,817 | N/A | N/A | N/A | N/A | N/A |
| Five persons | 11,999 | 12,173 | 11,801 | 11,512 | 11,336 | N/A | N/A | N/A | N/A |
| Six persons | 13,801 | 13,855 | 13,570 | 13,296 | 12,890 | 12,649 | N/A | N/A | N/A |
| Seven persons | 15,879 | 15,979 | 15,637 | 15,399 | 14,955 | 14,437 | 13,869 | N/A | N/A |
| Eight persons or more | 17,760 | 17,917 | 17,594 | 17,312 | 16,911 | 16,403 | 15,872 | 15,738 | N/A |
| Nine persons or more | 21,364 | 21,468 | 21,183 | 20,943 | 20,549 | 20,008 | 19,517 | 19,397 | 18,649 |
| Source: U.S. Census Bureau | |||||||||
| Race Combinations | |
| Two or More Races (57 Possible Specified Combinations) | |
| 1 | White; Black or African American |
| 2 | White; American Indian and Alaska Native |
| 3 | White; Asian |
| 4 | White; Native Hawaiian and Other Pacific Islander |
| 5 | White; Some Other Race |
| 6 | Black or African American; American Indian and Alaska Native |
| 7 | Black or African American; Asian |
| 8 | Black or African American; Native Hawaiian and Other Pacific Islander |
| 9 | Black or African American; Some Other Race |
| 10 | American Indian and Alaska Native; Asian |
| 11 | American Indian and Alaska Native; Native Hawaiian and Other Pacific Islander |
| 12 | American Indian and Alaska Native; Some other race |
| 13 | Asian; Native Hawaiian and Other Pacific Islander |
| 14 | Asian; Some Other Race |
| 15 | Native Hawaiian and Other Pacific Islander; Some Other Race |
| 16 | White; Black or African American; American Indian and Alaska Native |
| 17 | White; Black or African American; Asian |
| 18 | White; Black or African American; Native Hawaiian and Other Pacific Islander |
| 19 | White; Black or African American; Some Other Race |
| 20 | White; American Indian and Alaska Native; Asian |
| 21 | White; American Indian and Alaska Native; Native Hawaiian and Other Pacific Islander |
| 22 | White; American Indian and Alaska Native; Some Other Race |
| 23 | White; Asian; Native Hawaiian and Other Pacific Islander |
| 24 | White; Asian; Some Other Race |
| 25 | White; Native Hawaiian and Other Pacific Islander; Some Other Race |
| 26 | Black or African American; American Indian and Alaska Native; Asian |
| 27 | Black or African American; American Indian and Alaska Native; Native Hawaiian and Other Pacific Islander |
| 28 | Black or African American; American Indian and Alaska Native; Some Other Race |
| 29 | Black or African American; Asian; Native Hawaiian and Other Pacific Islander |
| 30 | Black or African American; Asian; Some Other Race |
| 31 | Black or African American; Native Hawaiian and Other Pacific Islander; Some Other Race |
| 32 | American Indian and Alaska Native; Asian; Native Hawaiian and Other Pacific Islander |
| 33 | American Indian and Alaska Native; Asian; Some Other Race |
| 34 | American Indian and Alaska Native; Native Hawaiian and Other Pacific Islander; Some Other Race |
| 35 | Asian; Native Hawaiian and Other Pacific Islander; Some Other Race |
| 36 | White; Black or African American; American Indian and Alaska Native; Asian |
| 37 | White; Black or African American; American Indian and Alaska Native; Native Hawaiian and Other Pacific Islander |
| 38 | White; Black or African American; American Indian and Alaska Native; Some Other Race |
| 39 | White; Black or African American; Asian; Native Hawaiian and Other Pacific Islander |
| 40 | White; Black or African American; Asian; Some Other Race |
| 41 | White; Black or African American; Native Hawaiian and Other Pacific Islander; Some Other Race |
| 42 | White; American Indian and Alaska Native; Asian; Native Hawaiian and Other Pacific Islander |
| 43 | White; American Indian and Alaska Native; Asian; Some Other Race |
| 44 | White; American Indian and Alaska Native; Native Hawaiian and Other Pacific Islander; Some other race |
| 45 | White; Asian; Native Hawaiian and Other Pacific Islander; Some Other Race |
| 46 | Black or African American; American Indian and Alaska Native; Asian; Native Hawaiian and Other Pacific Islander |
| 47 | Black or African American; American Indian and Alaska Native; Asian; Some Other Race |
| 48 | Black or African American; American Indian and Alaska Native; Native Hawaiian and Other Pacific Islander; Some Other Race |
| 49 | Black or African American; Asian; Native Hawaiian and Other Pacific Islander; Some Other Race |
| 50 | American Indian and Alaska Native; Asian; Native Hawaiian and Other Pacific Islander; Some Other Race |
| 51 | White; Black or African American; American Indian and Alaska Native; Asian; Native Hawaiian and Other Pacific Islander |
| 52 | White; Black or African American; American Indian and Alaska Native; Asian; Some Other Race |
| 53 | White; Black or African American; American Indian and Alaska Native; Native Hawaiian and Other Pacific Islander; Some Other Race |
| 54 | White; Black or African American; Asian; Native Hawaiian and Other Pacific Islander; Some Other Race |
| 55 | White; American Indian and Alaska Native; Asian; Native Hawaiian and Other Pacific Islander; Some Other Race |
| 56 | Black or African American; American Indian and Alaska Native; Asian; Native Hawaiian and Other Pacific Islander; Some Other Race |
| 57 | White; Black or African American; American Indian and Alaska Native; Asian; Native Hawaiian and Other Pacific Islander; Some Other Race |
Median Standard Distributions
In order to provide consistency in the values within and among data products, standard distributions from which medians and quartiles are calculated are used for the American Community Survey.
Standard Distribution for Median Age:
[116 data cells]
Under 1 year
1 year
2 years
3 years
4 years
5 years
.
.
.
112 years
113 years
114 years
115 years and over
Standard Distribution for Median Agricultural Crop Sales:
[5 data cells]
Less than $1,000
$1,000 to $2,499
$2,500 to $4,999
$5,000 to $9,999
$10,000 or more
Standard Distribution for Median Bedrooms:
[9 data cells]
No bedroom
1 bedroom
2 bedrooms
3 bedrooms
4 bedrooms
5 bedrooms
6 bedrooms
7 bedrooms
8 or more bedrooms
Standard Distribution for Median Condominium Fees:
[15 data cells]
Less than $50
$50 to $99
$100 to $199
$200 to $299
$300 to $399
$400 to $499
$500 to $599
$600 to $699
$700 to $799
$800 to $899
$900 to $999
$1,000 to $1,249
$1,250 to $1,499
$1,500 to $1,749
$1,750 or more
Standard Distribution for Median Contract Rent/Quartile Contract Rent/Rent Asked/Gross Rent:
[23 data cells]
Less than $100
$100 to $149
$150 to $199
$200 to $249
$250 to $299
$300 to $349
$350 to $399
$400 to $449
$450 to $499
$500 to $549
$550 to $599
$600 to $649
$650 to $699
$700 to $749
$750 to $799
$800 to $899
$900 to $999
$1,000 to $1,249
$1,250 to $1,499
$1,500 to $1,999
$2,000 to $2,499
$2,500 to $2,999
$3,000 or more
Standard Distribution for Duration of Current Marriage:
[101 data cells]
Under 1 year
1 year
2 years
3 years
4 years
5 years
.
.
.
97 years
98 years
99 years
100 years and over
Standard Distribution for Median Earnings and Median Income (Individuals):
[101 data cells]
Less than $2,500
$2,500 to $4,999
$5,000 to $7,499
$7,500 to $9,999
$10,000 to $12,499
$12,500 to $14,999
$15,000 to $17,499
$17,500 to $19,999
$20,000 to $22,499
$22,500 to $24,999
$25,000 to $27,499
$27,500 to $29,999
$30,000 to $32,499
$32,500 to $34,999
$35,000 to $37,499
$37,500 to $39,999
$40,000 to $42,499
$42,500 to $44,999
$45,000 to $47,499
$47,500 to $49,999
$50,000 to $52,499
$52,500 to $54,999
$55,000 to $57,499
$57,500 to $59,999
$60,000 to $62,499
$62,500 to $64,999
$65,000 to $67,499
$67,500 to $69,999
$70,000 to $72,499
$72,500 to $74,999
$75,000 to $77,499
$77,500 to $79,999
$80,000 to $82,499
$82,500 to $84,999
$85,000 to $87,499
$87,500 to $89,999
$90,000 to $92,499
$92,500 to $94,999
$95,000 to $97,499
$97,500 to $99,999
$100,000 to $102,499
$102,500 to $104,999
$105,000 to $107,499
$107,500 to $109,999
$110,000 to $112,499
$112,500 to $114,999
$115,000 to $117,499
$117,500 to $119,999
$120,000 to $122,499
$122,500 to $124,999
$125,000 to $127,499
$127,500 to $129,999
$130,000 to $132,499
$132,500 to $134,999
$135,000 to $137,499
$137,500 to $139,999
$140,000 to $142,499
$142,500 to $144,999
$145,000 to $147,499
$147,500 to $149,999
$150,000 to $152,499
$152,500 to $154,999
$155,000 to $157,499
$157,500 to $159,999
$160,000 to $162,499
$162,500 to $164,999
$165,000 to $167,499
$167,500 to $169,999
$170,000 to $172,499
$172,500 to $174,999
$175,000 to $177,499
$177,500 to $179,999
$180,000 to $182,499
$182,500 to $184,999
$185,000 to $187,499
$187,500 to $189,999
$190,000 to $192,499
$192,500 to $194,999
$195,000 to $197,499
$197,500 to $199,999
$200,000 to $202,499
$202,500 to $204,999
$205,000 to $207,499
$207,500 to $209,999
$210,000 to $212,499
$212,500 to $214,999
$215,000 to $217,499
$217,500 to $219,999
$220,000 to $222,499
$222,500 to $224,999
$225,000 to $227,499
$227,500 to $229,999
$230,000 to $232,499
$232,500 to $234,999
$235,000 to $237,499
$237,500 to $239,999
$240,000 to $242,499
$242,500 to $244,999
$245,000 to $247,499
$247,500 to $249,999
$250,000 or more
Standard Distribution for Median Fire, Hazard, and Flood Insurance:
[19 data cells]
$0
$1 to $49
$50 to $99
$100 to $149
$150 to $199
$200 to $249
$250 to $299
$300 to $349
$350 to $399
$400 to $449
$450 to $499
$500 to $599
$600 to $699
$700 to $799
$800 to $899
$900 to $999
$1,000 to $1,499
$1,500 to $1,999
$2,000 or more
Standard Distribution for Median Gross Rent as a Percentage of Household Income:
[13 data cells]
Less than 10.0 percent
10.0 to 14.9 percent
15.0 to 19.9 percent
20.0 to 24.9 percent
25.0 to 29.9 percent
30.0 to 34.9 percent
35.0 to 39.9 percent
40.0 to 49.9 percent
50.0 to 59.9 percent
60.0 to 69.9 percent
70.0 to 79.9 percent
80.0 to 89.9 percent
90.0 percent or more
Standard Distribution for Median Income in the Past 12 Months (Household/Family/Nonfamily Household):
[101 data cells]
Less than $2,500
$2,500 to $4,999
$5,000 to $7,499
$7,500 to $9,999
$10,000 to $12,499
$12,500 to $14,999
$15,000 to $17,499
$17,500 to $19,999
$20,000 to $22,499
$22,500 to $24,999
$25,000 to $27,499
$27,500 to $29,999
$30,000 to $32,499
$32,500 to $34,999
$35,000 to $37,499
$37,500 to $39,999
$40,000 to $42,499
$42,500 to $44,999
$45,000 to $47,499
$47,500 to $49,999
$50,000 to $52,499
$52,500 to $54,999
$55,000 to $57,499
$57,500 to $59,999
$60,000 to $62,499
$62,500 to $64,999
$65,000 to $67,499
$67,500 to $69,999
$70,000 to $72,499
$72,500 to $74,999
$75,000 to $77,499
$77,500 to $79,999
$80,000 to $82,499
$82,500 to $84,999
$85,000 to $87,499
$87,500 to $89,999
$90,000 to $92,499
$92,500 to $94,999
$95,000 to $97,499
$97,500 to $99,999
$100,000 to $102,499
$102,500 to $104,999
$105,000 to $107,499
$107,500 to $109,999
$110,000 to $112,499
$112,500 to $114,999
$115,000 to $117,499
$117,500 to $119,999
$120,000 to $122,499
$122,500 to $124,999
$125,000 to $127,499
$127,500 to $129,999
$130,000 to $132,499
$132,500 to $134,999
$135,000 to $137,499
$137,500 to $139,999
$140,000 to $142,499
$142,500 to $144,999
$145,000 to $147,499
$147,500 to $149,999
$150,000 to $152,499
$152,500 to $154,999
$155,000 to $157,499
$157,500 to $159,999
$160,000 to $162,499
$162,500 to $164,999
$165,000 to $167,499
$167,500 to $169,999
$170,000 to $172,499
$172,500 to $174,999
$175,000 to $177,499
$177,500 to $179,999
$180,000 to $182,499
$182,500 to $184,999
$185,000 to $187,499
$187,500 to $189,999
$190,000 to $192,499
$192,500 to $194,999
$195,000 to $197,499
$197,500 to $199,999
$200,000 to $202,499
$202,500 to $204,999
$205,000 to $207,499
$207,500 to $209,999
$210,000 to $212,499
$212,500 to $214,999
$215,000 to $217,499
$217,500 to $219,999
$220,000 to $222,499
$222,500 to $224,999
$225,000 to $227,499
$227,500 to $229,999
$230,000 to $232,499
$232,500 to $234,999
$235,000 to $237,499
$237,500 to $239,999
$240,000 to $242,499
$242,500 to $244,999
$245,000 to $247,499
$247,500 to $249,999
$250,000 or more
Standard Distribution for Median Monthly Housing Costs:
[30 cells]
Less than $100
$100 to $149
$150 to $199
$200 to $249
$250 to $299
$300 to $349
$350 to $399
$400 to $449
$450 to $499
$500 to $549
$550 to $599
$600 to $649
$650 to $699
$700 to $749
$750 to $799
$800 to $899
$900 to $999
$1,000 to $1,249
$1,250 to $1,499
$1,500 to $1,749
$1,750 to $1,999
$2,000 to $2,499
$2,500 to $2,999
$3,000 to $3,499
$3,500 to $3,999
$4,000 to $4,499
$4,500 to $4,999
$5,000 to $5,499
$5,500 to $5,999
$6,000 or more
Standard Distribution for Median Real Estate Taxes Paid:
[14 data cells]
Less than $200
$200 to $299
$300 to $399
$400 to $599
$600 to $799
$800 to $999
$1,000 to $1,499
$1,500 to $1,999
$2,000 to $2,999
$3,000 to $3,999
$4,000 to $4,999
$5,000 to $7,499
$7,500 to $9,999
$10,000 or more
Standard Distribution for Median Rooms:
[14 data cells]
1 room
2 rooms
3 rooms
4 rooms
5 rooms
6 rooms
7 rooms
8 rooms
9 rooms
10 rooms
11 rooms
12 rooms
13 rooms
14 or more rooms
Standard Distribution for Median Selected Monthly Owner Costs/Median Selected Monthly Owner Costs by Mortgage Status (With a Mortgage):
[23 data cells]
Less than $100
$100 to $199
$200 to $299
$300 to $399
$400 to $499
$500 to $599
$600 to $699
$700 to $799
$800 to $899
$900 to $999
$1,000 to $1,249
$1,250 to $1,499
$1,500 to $1,749
$1,750 to $1,999
$2,000 to $2,499
$2,500 to $2,999
$3,000 to $3,499
$3,500 to $3,999
$4,000 to $4,499
$4,500 to $4,999
$5,000 to $5,499
$5,500 to $5,999
$6,000 or more
Standard Distribution for Median Selected Monthly Owner Costs by Mortgage Status (Without a Mortgage):
[17 data cells]
Less than $100
$100 to $149
$150 to $199
$200 to $249
$250 to $299
$300 to $349
$350 to $399
$400 to $499
$500 to $599
$600 to $699
$700 to $799
$800 to $899
$900 to $999
$1,000 to $1,249
$1,250 to $1,499
$1,500 to $1,999
$2,000 or more
Standard Distribution for Median Selected Monthly Owner Costs as a Percentage of Household Income by Mortgage Status:
[13 data cells]
Less than 10.0 percent
10.0 to 14.9 percent
15.0 to 19.9 percent
20.0 to 24.9 percent
25.0 to 29.9 percent
30.0 to 34.9 percent
35.0 to 39.9 percent
40.0 to 49.9 percent
50.0 to 59.9 percent
60.0 to 69.9 percent
70.0 to 79.9 percent
80.0 to 89.9 percent
90.0 percent or more
Standard Distribution for Median Total Mortgage Payment:
[21 data cells]
Less than $100
$100 to $199
$200 to $299
$300 to $399
$400 to $499
$500 to $599
$600 to $699
$700 to $799
$800 to $899
$900 to $999
$1,000 to $1,249
$1,250 to $1,499
$1,500 to $1,749
$1,750 to $1,999
$2,000 to $2,499
$2,500 to $2,999
$3,000 to $3,499
$3,500 to $3,999
$4,000 to $4,499
$4,500 to $4,999
$5,000 or more
Standard Distribution for Median Usual Hours Worked Per Week Worked in the Past 12 Months:
[9 data cells]
Usually worked 50 to 99 hours per week
Usually worked 45 to 49 hours per week
Usually worked 41 to 44 hours per week
Usually worked 40 hours per week
Usually worked 35 to 39 hours per week
Usually worked 30 to 34 hours per week
Usually worked 25 to 29 hours per week
Usually worked 15 to 24 hours per week
Usually worked 1 to 14 hours per week
Standard Distribution for Median Value/Quartile Value/Price Asked:
[24 data cells]
Less than $10,000
$10,000 to $14,999
$15,000 to $19,999
$20,000 to $24,999
$25,000 to $29,999
$30,000 to $34,999
$35,000 to $39,999
$40,000 to $49,999
$50,000 to $59,999
$60,000 to $69,999
$70,000 to $79,999
$80,000 to $89,999
$90,000 to $99,999
$100,000 to $124,999
$125,000 to $149,999
$150,000 to $174,999
$175,000 to $199,999
$200,000 to $249,999
$250,000 to $299,999
$300,000 to $399,999
$400,000 to $499,999
$500,000 to $749,999
$750,000 to $999,999
$1,000,000 or more
Standard Distribution for Median Vehicles Available:
[6 data cells]
No vehicle available
1 vehicle available
2 vehicles available
3 vehicles available
4 vehicles available
5 or more vehicles available
Standard Distribution for Median Year Householder Moved Into Unit:
[18 data cells]
Moved in 2013
Moved in 2012
Moved in 2011
Moved in 2010
Moved in 2009
Moved in 2008
Moved in 2007
Moved in 2006
Moved in 2005
Moved in 2004
Moved in 2003
Moved in 2002
Moved in 2001
Moved in 2000
Moved in 1990 to 1999
Moved in 1980 to 1989
Moved in 1970 to 1979
Moved in 1969 or earlier
Standard Distribution for Median Year Structure Built:
[21 data cells]
Built in 2013
Built in 2012
Built in 2011
Built in 2010
Built in 2009
Built in 2008
Built in 2007
Built in 2006
Built in 2005
Built in 2004
Built in 2003
Built in 2002
Built in 2001
Built in 2000
Built 1990 to 1999
Built 1980 to 1989
Built 1970 to 1979
Built 1960 to 1969
Built 1950 to 1959
Built 1940 to 1949
Built 1939 or earlier
Group quarters include such places as college residence halls, residential treatment centers, skilled nursing facilities, group homes, military barracks, correctional facilities, and workers' dormitories.
Examples are halfway houses, restitution centers, and prerelease, work release, and study centers.
Examples are residential training schools and farms, reception and diagnostic centers, group homes operated by or for correctional authorities, detention centers, and boot camps for juvenile delinquents.
Examples are maternity homes for unwed mothers, orphanages, and homes for abused and neglected children in need of services. Group homes for juveniles do not include residential treatment centers for juveniles or group homes operated by or for correctional authorities.
Residential Schools for People with Disabilities
Includes schools that provide the teaching of skills for daily living, education programs, and care for students with disabilities in a live-in environment.
Examples are residential schools for the physically or developmentally disabled.
Students attending the U.S. Naval Academy, the U.S. Military Academy (West Point), the U.S. Coast Guard Academy, and the U.S. Air Force Academy are interviewed in military group quarters.
- shelters that operate on a first-come, first-serve basis where people must leave in the morning and have no guaranteed bed for the next night;
- shelters where people know that they have a bed for a specified period of time (even if they leave the building every day); and
- shelters that provide temporary shelter during extremely cold weather (such as churches). This category does not include shelters that operate only in the event of a natural disaster.
Examples are emergency and transitional shelters; missions; hotels and motels used to shelter people experiencing homelessness; shelters for children who are runaways, neglected or experiencing homelessness; and similar places known to have people experiencing homelessness.
Living quarters for students living or staying in seminaries are classified as college student housing not religious group quarters.
Examples are group living quarters at migratory farm worker camps, construction workers' camps, Job Corps centers, and vocational training facilities, and energy enclaves in Alaska.
1. ACS data from published tables on American FactFinder
All ACS estimates from tables on AFF include either the 90 percent margin of error or 90 percent confidence bounds. The margin of error is the maximum difference between the estimate and the upper and lower confidence bounds. Most tables on AFF containing 2005 or later ACS data display the margin of error.
Use the margin of error to calculate the standard error (dropping the "+/-" from the displayed value first) as:
Standard Error = Margin of Error / Z
where Z = 1.645 for 2006 ACS data and recent years. Users of 2005 and earlier ACS data should use Z= 1.65
If confidence bounds are provided instead (as with most ACS data products for 2004 and earlier), calculate the margin of error first before calculating the standard error:
Margin of Error = max (upper bound - estimate, estimate - lower bound)
All published ACS estimates use 1.645 (for 2006 and recent years) to calculate 90 percent margins of error and confidence bounds. ACS estimates for years earlier than 2006 should use 1.65. Other surveys may use other values.
2. ACS public-use microdata sample (PUMS) tabulations
Using the methods described in the Accuracy of the PUMS documentation users can calculate standard errors for their tabulations using a design factor method or a replicate weight method. For example, 2012 Accuracy of the PUMS documentation can be used with the 2012 ACS PUMS file to calculate standard errors. This document is available under Data and Documentation on the ACS website http://www.census.gov/acs/www/ .
NOTE: ACS PUMS design factors provided in the Accuracy of the PUMS document should not be used to calculate standard errors of full ACS sample estimates, such as those found in data tables on AFF. In addition, Census 2000 design factors should not be used to calculate standard errors for any ACS estimate.
All methods in this section are approximations and users should be cautious in using them. This is because these methods do not consider the correlation or covariance between the basic estimates. They may be overestimates or underestimates of the derived estimate's standard error depending on whether the two basic estimates are highly correlated in either the positive or negative direction. As a result, the approximated standard error may not match direct calculations of standard errors or calculations obtained through other methods.
- Sum or Difference of Estimates

As the number of basic estimates involved in the sum or difference increases, the results of this formula become increasingly different from the standard error derived directly from the ACS microdata. Care should be taken to work with the fewest number of basic estimates as possible. If there are estimates involved in the sum that are controlled in the weighting then the approximate standard error can be tremendously different.
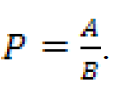
- Proportions and Percents
Here we define a proportion as a ratio where the numerator is a subset of the denominator, for example the proportion of persons 25 and over with a high school diploma or higher.
Let
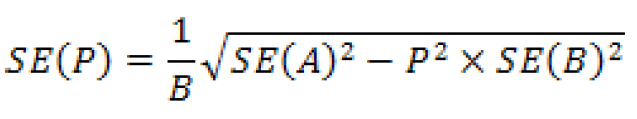
If the value under the square root sign is negative, then instead use
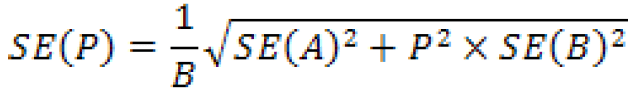
If P = 1 then use
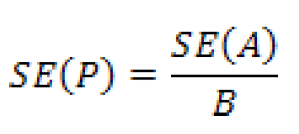
If Q = 100% x P (a percent instead of a proportion), then SE(Q) = 100% x SE(P).
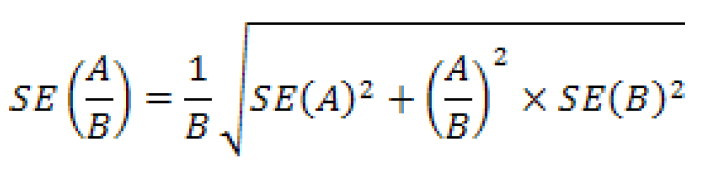
- Means and Other Ratios
If the estimate is a ratio but the numerator is not a subset of the denominator, such as persons per household, per capita income, or percent change, then
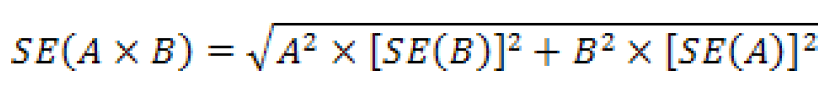
- Products
For a product of two estimates - for example if users want to estimate a proportion's numerator by multiplying the proportion by its denominator - the standard error can be approximated as
Users may combine these procedures for complicated estimates. For example, if the desired estimate is
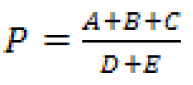 then SE(A+B+C) and SE(D+E) can be estimated first, and then those results used to calculate SE(P).
For examples of these formulas, please see any Accuracy of the Data document available under Data and Documentation on the ACS website http://www.census.gov/acs/www/.
Instructions for Statistical Testing
Once standard errors have been obtained, doing the statistical test to determine significance is not difficult. The determination of statistical significance takes into account the difference between the two estimates as well as the standard errors of both estimates. For two estimates, A and B, with standard errors SE(A) and SE(B), let
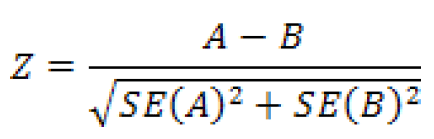
If Z < -1.645 or Z > 1.645, then the difference between A and B is significant at the 90 percent confidence level. Otherwise, the difference is not significant. This means that there is less than a 10 percent chance that the difference between these two estimates would be as large or larger by random chance alone.
This is the method used in determining statistical significance for the ACS Comparison Profiles published on AFF. Note that the user's determination of statistical significance may not match the results in the Comparison Profile for the same pair of estimates, because the significance tests for Comparison Profiles are made using unrounded standard errors. Standard errors obtained from the rounded margins of error or confidence bounds are unlikely to match the unrounded standard error, and so statistical tests may differ.
Users may choose to apply a confidence level different from 90 percent to their tests of statistical significance. For example, if Z < -1.96 or Z > 1.96, then the difference between A and B is significant at the 95 percent confidence level.
This method can be used for any types of estimates: counts, percentages, proportions, means, medians, etc. It can be used for comparing across years, or across surveys. If one of the estimates is a fixed value or comes from a source without sampling error (such as a count from the 2010 Census), use zero for the standard error for that estimate in the above equation for Z.
NOTE: Making comparisons between ACS single-year and multiyear estimates is very difficult, and is not advised.
In addition, using the rule of thumb of overlapping confidence intervals does not constitute a valid significance test and users are discouraged from using that method.

